

Container Terminal Operations Optimizer
Optimize container terminal operations with data-driven scheduling and bottleneck analysis
What You Can Do
Analyze vessel schedules, berth assignments, crane utilization, and gate throughput data to identify operational bottlenecks and performance gaps. Claude helps you generate optimization recommendations, forecast terminal capacity constraints, and prioritize improvements based on impact. You make faster, more informed operational decisions backed by real performance analysis.
Features
Review arrival patterns, dwell times, and berth utilization to spot inefficiencies in your scheduling process and reduce idle vessel time
Pinpoint capacity constraints at gates, crane bays, storage blocks, and truck staging areas that slow container throughput
Get actionable suggestions for crane allocation, labor scheduling, and equipment positioning to improve efficiency
Benchmark your terminal against industry standards for moves per hour, ship-to-shore utilization, and gate dwell times
Project terminal throughput limits under various vessel arrival scenarios and seasonal demand patterns
Convert raw operational data into clear charts, heatmaps, and trend analysis that stakeholders can understand immediately
Dig into specific operational issues to understand why performance dips occur and what systemic factors drive them
Example Output
Scenario 1: Gate Bottleneck Analysis
Input: Daily gate transaction logs from the past 30 days
Output:
Gate Bottleneck Identified: Main vehicle gate (Gate 1-3) peaks at 35
transactions/hour (industry standard: 45+). Peak times: 10am-12pm, 2pm-4pm.

Root Cause: Lane allocation suboptimal during morning peak; documentation
checking averages 3.2 min/transaction vs. 2.1 min industry average.

Recommendation: Add dedicated documentation review lane; implement parallel
processing for pre-cleared containers; shift 15% of non-urgent transactions
to 8-9am window. Projected impact: +12 transactions/hour during peak.
Scenario 2: Crane Utilization Report
Input: Ship-to-shore crane logs, vessel schedules, and weather data
Output:
Crane Fleet Utilization: 62% average (target: 75%)
- Crane 1-2: 71% (high performing)
- Crane 3-4: 58% (underutilized)
- Crane 5: 48% (inspection downtime accounts for 8% gap)

Action Items:
1. Redistribute workload: route 40% more export containers to Crane 1-2
2. Pre-position import stacks closer to Crane 3-4 pick zones
3. Align ground handling with crane availability cycles
Projected impact: +8-10 percentage points utilization; 12% faster cycle times.
Scenario 3: Schedule Conflicts Detected
Input: Berthing schedule (next 60 days), vessel specs, historical dwell times
Output:
Schedule Risk: Two 20,000-TEU vessels scheduled for 12-hour overlap; current
berth capacity supports sequential processing only.

Current Plan: 36-hour dwell per vessel
Optimized: Stagger arrival by 2 hours; reduce dwell to 28 hours average

Forecast: Terminal utilization peaks at 91% in Week 3. Recommend temporary
berth leasing for days 18-21.
What's Included
- Performance Baseline Analysis: Initial assessment of your current terminal metrics compared to industry benchmarks across all operational areas
- Bottleneck Detection Workflow: Step-by-step framework to consistently identify where your terminal loses efficiency, prioritized by impact
- Optimization Scenario Generator: Templates for testing hypothetical changes without operational disruption
- Weekly Briefing Template: Ready-to-use report format for presenting findings to operations, commercial, and executive teams
- KPI Tracking Dashboard Data: Structured data exports formatted for your existing BI tools or dashboards
Who It's For
- Terminal Operations Managers
- Port Planning and Scheduling Coordinators
- Supply Chain Optimization Analysts
- Logistics Operations Directors
- Vessel Scheduling Planners
Best For
- Diagnosing why gate dwell times are increasing
- Planning berth assignments for incoming vessel schedules
- Identifying crane underutilization and workload imbalances
- Forecasting peak season capacity constraints
- Comparing your performance against industry benchmarks
You might also like

You get expert design critique and optimization recommendations for small watercraft projects, from initial concept sketches to detailed plans. Claude analyzes your designs for hydrodynamic efficiency, structural integrity, material optimization, and buildability, then provides specific improvements to reduce weight, improve performance, and ensure seaworthiness.
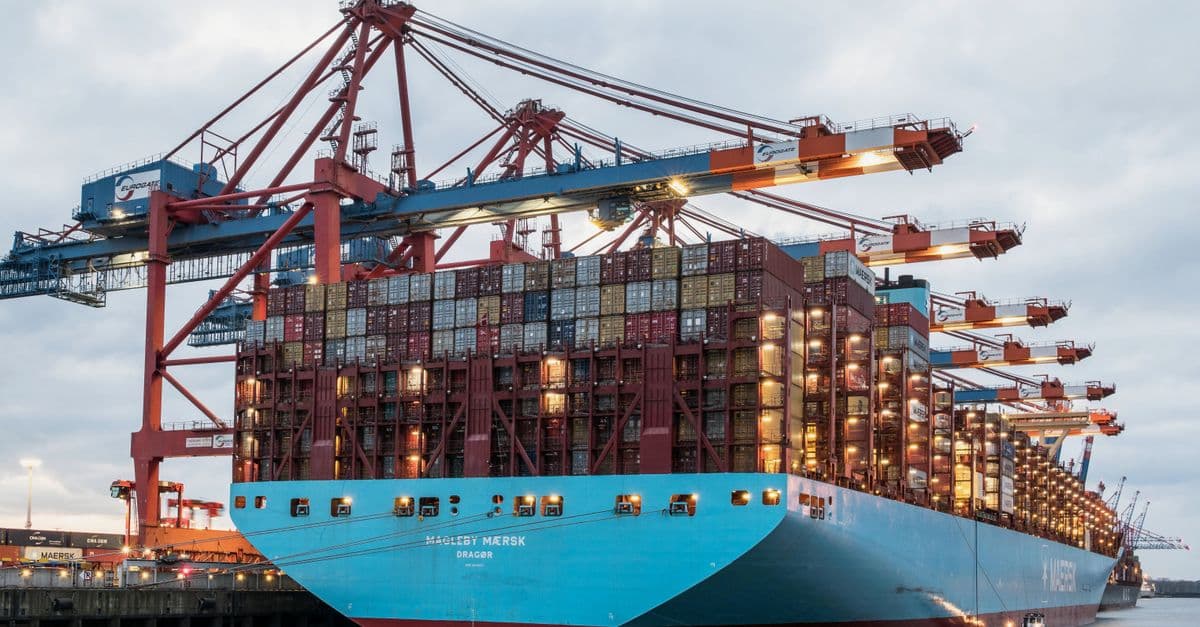
This skill rapidly analyzes ship hulls for hydrodynamic performance, stability characteristics, and maritime regulatory compliance. You provide hull geometry data, design parameters, or vessel specifications, and Claude performs comprehensive assessments including resistance predictions, stability calculations, and compliance checks against IMO and classification society standards. Accelerate your design iteration cycles by automating preliminary analysis that normally requires specialized software and weeks of external consultant review.

You can accelerate the preliminary design phase of shipbuilding projects by analyzing design briefs against regulatory standards, evaluating hull resistance and propulsion requirements, and generating technical compliance documentation. This skill helps naval architects and marine engineers validate design concepts early, identify compliance gaps before detailed design begins, and produce documentation suitable for regulatory review boards and client presentations.

Accelerate marine propulsion and auxiliary system design by automating FMEA analysis, validating against IMO and classification society standards, and generating comprehensive risk assessments. You'll receive structured failure mode identification, severity/occurrence/detectability scoring, and regulatory compliance documentation that meets international maritime requirements.

You can input your small craft specifications, blueprints, or design parameters and receive detailed technical analysis, regulatory compliance documentation, and comprehensive design reports. The skill generates specification sheets, material recommendations, performance calculations, and safety documentation tailored to your vessel type and intended use.
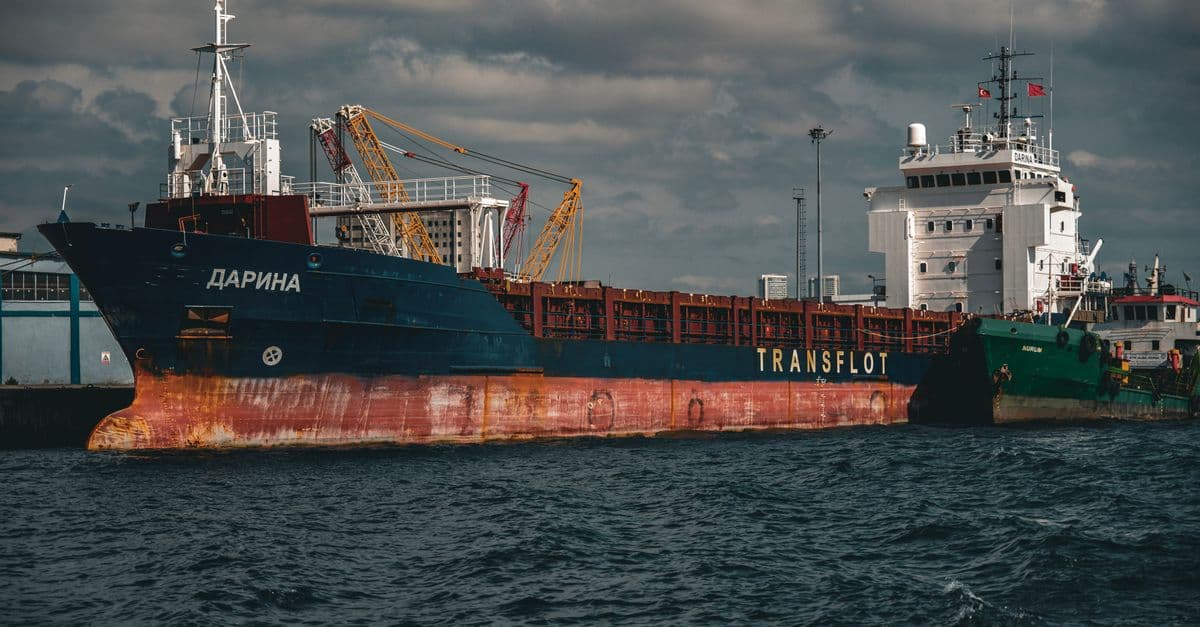
Analyze complex hull design trade-offs between performance metrics like stability, speed, and fuel efficiency. Validate your designs against maritime regulations including IMO SOLAS, MARPOL, and flag state requirements. Generate comprehensive design documentation and performance optimization recommendations to support faster, data-driven decision-making throughout your design cycle.
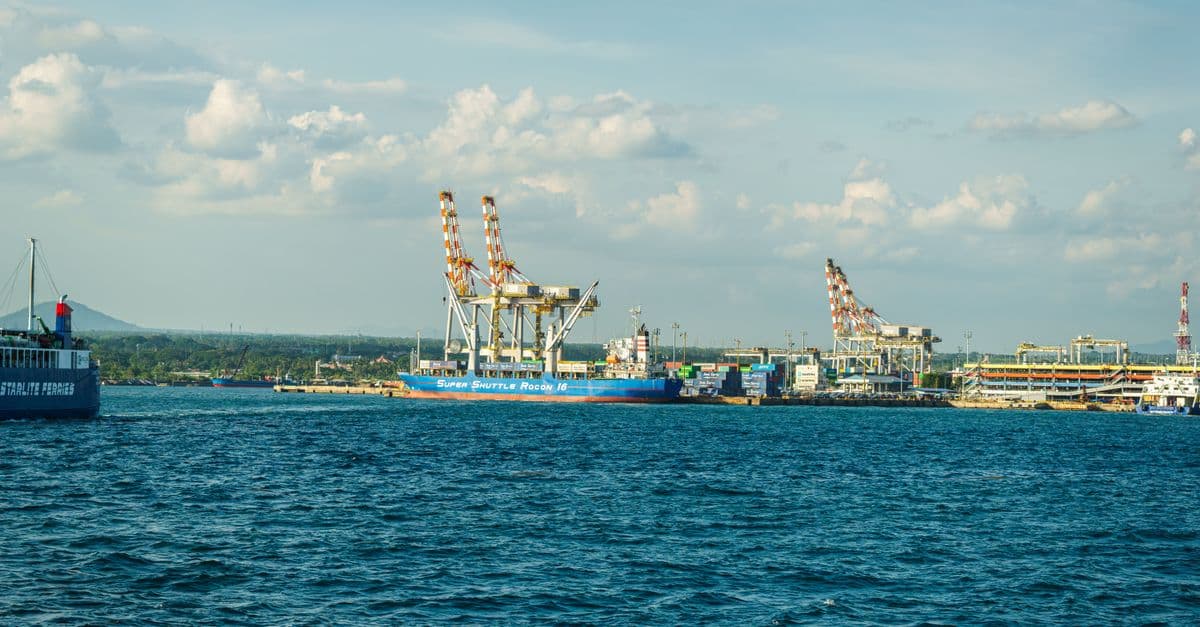
You can create comprehensive turnaround plans that optimize crew changes, passenger logistics, and vendor coordination while meeting port compliance requirements. This skill helps you manage multiple operational streams in parallel, anticipate delays, and maintain clear communication with all stakeholders involved in cruise ship port visits.

You receive comprehensive validation of marine system architectures against maritime standards including IMO, SOLAS, and MARPOL regulations. Claude identifies integration conflicts between subsystems (propulsion, navigation, power management), cross-system dependencies, and optimization opportunities while generating compliance documentation and remediation plans for each identified issue.