

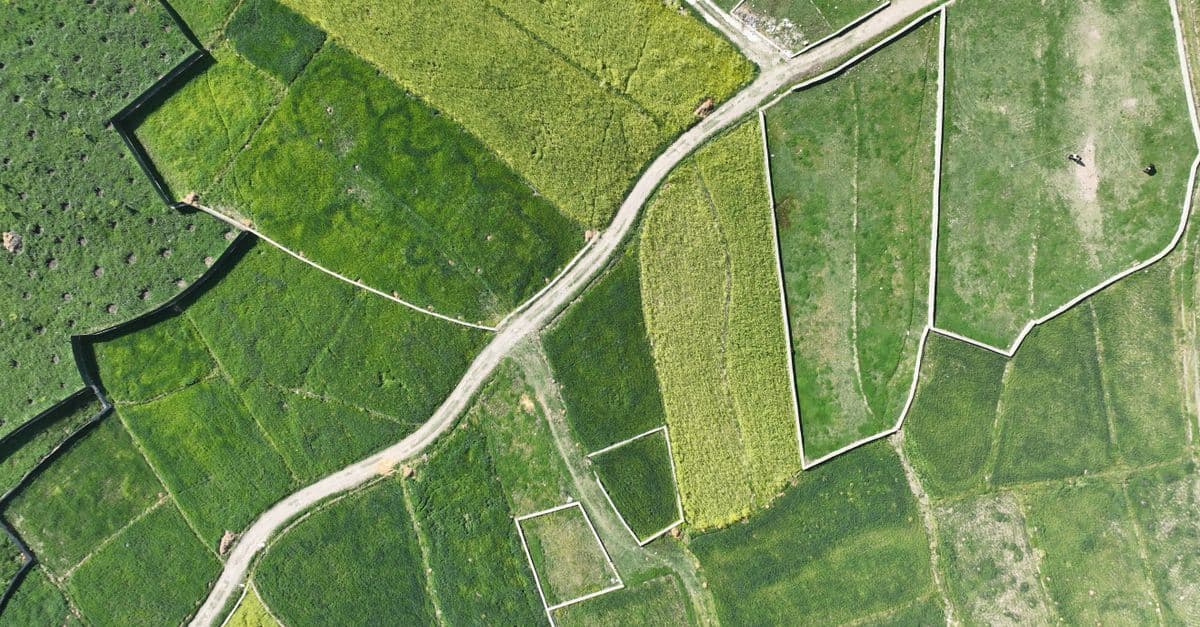
Topographic Survey Data Analysis & Interpretation
Analyze topographic survey data into contour maps and site reports
What You Can Do
You can systematically process GNSS/RTK survey data, generate accurate contour maps at appropriate intervals, identify break lines and drainage patterns, and produce professional site analysis reports. The skill helps you validate field measurements before delivery, detect errors that could trigger costly revisits, and document methodology with confidence intervals that engineers rely on for grading plans and earthwork cost estimation.
Features
detect measurement errors and anomalies in GNSS/RTK datasets before processing
produce maps at appropriate intervals (1', 2', 5') based on terrain slope and project requirements
systematically locate and classify ridges, valleys, and drainage patterns in survey data
build coherent topographic surfaces with proper ground vs. vegetation classification
generate professional documents addressing cut/fill volumes, slope stability, and drainage implications
record methodology, accuracy assessment, and confidence intervals per ASPD/USSM standards
provide volumetric data and slope analysis for cost estimation and construction sequencing
classify terrain features and identify grade-critical areas for engineer review
Example Output
Example 1: Contour Map Assessment
- Input: RTK survey file with 847 points across 12-acre site
- Analysis identifies 2.3% of points as potential outliers (vegetation interference), flags for field verification
- Output: Contour map at 2-foot intervals with note: "Break lines added along drainage swale (←→ drainage flow)"
- Estimated cut/fill: 4,200 cy cut / 1,850 cy fill
Example 2: Site Analysis Report Section
- Slope stability assessment: North slope averages 18% grade, exceeds recommended 15% for grass cover without reinforcement
- Recommendation: Specify erosion control matting or terracing in grading plan
- Drainage implication: Low point elevation 312.4' requires inlet at station 2+15, outfall to existing storm system
Example 3: Data Quality Documentation
- Survey accuracy: ±0.08' vertical (95% confidence), meets ASPD Class B standards
- 3 anomalous points excluded (vegetation spike); methodology documented for engineer sign-off
What's Included
- SKILL.md instruction file with systematic data processing workflow:
- Contour Map Checklist: validation steps, interval selection guide, break line classification matrix
- Site Analysis Report Template: sections for slope assessment, drainage analysis, earthwork volumes, construction implications
- Data Quality Framework: error detection protocols, confidence interval calculation, anomaly flagging procedures
- Industry Standards Reference: ASPD accuracy classes, USSM documentation requirements, state-specific guidelines
Who It's For
- Land surveyors processing field data into engineering deliverables
- Survey technicians validating GNSS/RTK measurements and identifying anomalies
- Construction estimators using topographic data for earthwork bid preparation
- Site civil engineers reviewing survey input for grading and drainage design
- Project managers coordinating survey deliverables with design and construction schedules
Best For
- Processing raw GNSS/RTK survey files into coherent topographic surfaces
- Generating contour maps at appropriate intervals for site development projects
- Identifying drainage patterns, break lines, and grade-critical terrain features
- Detecting measurement errors and data anomalies before submitting to engineers
- Preparing professional site analysis reports with cut/fill volumes and slope assessments
- Documenting survey methodology and accuracy compliance per industry standards
You might also like

Query your local Screenpipe instance to retrieve screen recordings, audio transcriptions, UI element accessibility trees, keyboard/mouse input logs, and productivity analytics. You can search by keywords, filter by content type (audio, OCR, accessibility, input), set time ranges, and extract structured data about your applications, meetings, and work sessions without sending data to external servers.
 by az9713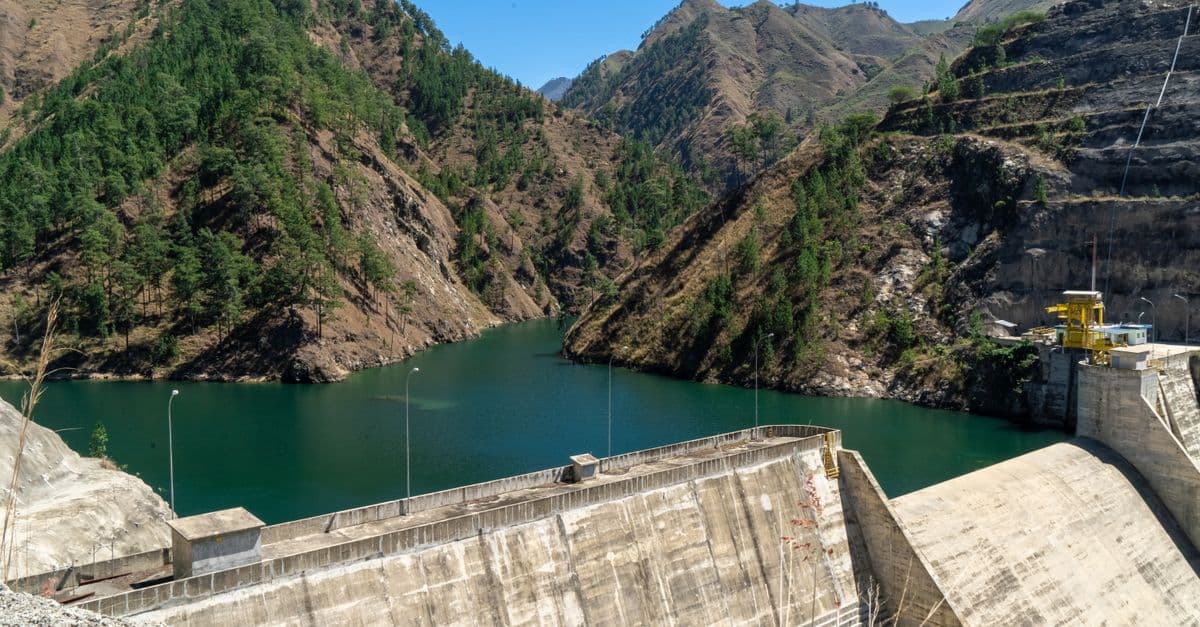
You can conduct comprehensive slope stability analyses that integrate site characterization, soil/rock properties, and quantitative calculations to evaluate both simple and complex slope geometries. The framework helps you identify critical failure mechanisms, calculate safety factors, assess groundwater and seismic effects, and develop technically defensible remediation recommendations suitable for permitting, design decisions, and stakeholder communication.
by az9713
You can systematically design test cases for any feature or system by analyzing requirements or code to extract test parameters, values, and business constraints. The skill generates a PICT model, executes pairwise testing logic to minimize test case count while maximizing coverage, and delivers a formatted test matrix with expected results—reducing manual test design effort while ensuring comprehensive scenario coverage.
by az9713
This skill deconstructs your writing samples to identify the specific patterns, personality markers, emotional range, language quirks, and formatting habits that make your voice uniquely yours. You'll receive a detailed voice DNA profile that includes your core communication style, signature phrases, emotional tone, formality level, and what you actively avoid—creating a blueprint that AI systems can use to replicate your authentic voice consistently across projects, platforms, and content types.
by az9713
You can submit architectural design documents, floor plans, and project parameters to receive a comprehensive compliance analysis that cross-references IBC, local amendments, zoning ordinances, and ADA accessibility requirements. Claude identifies specific gaps, cites applicable code sections, explains why each gap matters, and provides concrete remediation strategies—all before formal design review submission when corrections are costly and schedule-impacting.
by az9713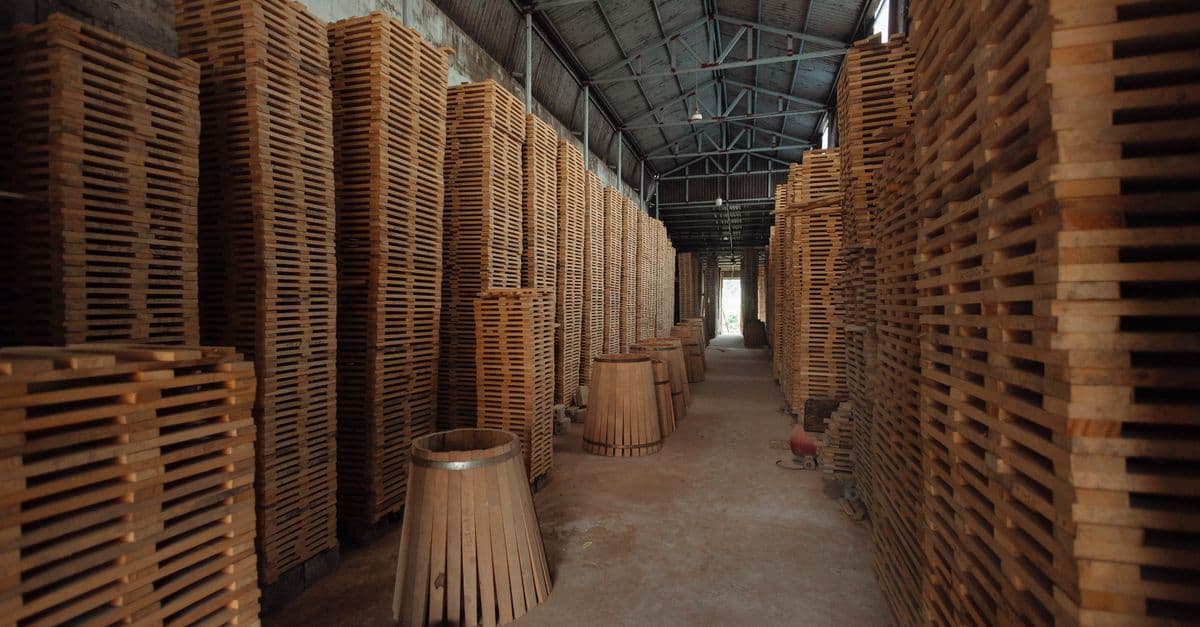
You can decompose complex timber structures into analyzable load paths, trace forces from applied loads through members to supports, and calculate governing demands for each structural element. This skill helps you identify critical design points, apply appropriate load factors and duration adjustments, and create defensible design documentation that satisfies code officials and peer reviewers.
by az9713
You can compare building materials across embodied carbon, water usage, recyclability, supply chain impacts, and lifecycle costs—all grounded in industry standards like EN 15804 and ISO 14040/44. This skill transforms material selection from intuition-based guessing into data-driven specification, producing analysis outputs ready for client presentations, value engineering discussions, and regulatory compliance documentation.
by az9713
You can accelerate HVAC design workflows by inputting building parameters—envelope characteristics, occupancy data, climate conditions, and existing systems—and receiving calculated heating/cooling loads, equipment sizing recommendations, and zone-by-zone analysis. Claude organizes complex building data into actionable design parameters and specification summaries for client review, permit submission, and professional validation against ASHRAE and ACCA standards.
by az9713