


Topographic Analysis & Cartographic Interpretation
Extract, validate, and interpret elevation data for accurate topographic maps

What You Can Do
You can systematically extract elevation data from LIDAR, GPS surveys, and government sources, then validate contour line accuracy against field observations and reference benchmarks. The skill helps you select appropriate contour intervals for terrain complexity, identify data anomalies and interpolation artifacts, and generate slope analysis and aspect maps that communicate terrain complexity to planners and engineers with confidence in accuracy.
Features
Process LIDAR, GPS, and government elevation datasets while identifying data voids and inconsistencies
Calculate mathematically precise contour lines at appropriate intervals for your terrain complexity and project scale
Create slope analysis maps, aspect maps, and hydrologic flow predictions for decision-making
Identify interpolation artifacts, verify elevation profiles against field observations, and flag anomalies before they impact planning decisions
Compare historical survey data with current elevations to document land changes over time
Generate cartographic products that clearly convey terrain complexity to planners, engineers, and public audiences
Ensure all outputs meet USGS, NRCS, or local government geodetic and cartographic specifications
Systematically screen elevation grids for errors that could compromise urban planning decisions
Example Output
Example 1: Contour Interval Recommendation
- Input: LIDAR elevation dataset covering 500-acre urban development site with elevation range 245–892 feet
- Output: Recommendation for 10-foot contour intervals with supplementary 2-foot intermediate contours in slopes >15%; identification of 3 data voids in riparian zone; validation that 94.2% of contours meet vertical accuracy standards within ±2 feet
Example 2: Slope & Aspect Analysis
- Input: DEM from county survey dated 2019
- Output: Slope map classified by development suitability (0–5°, 5–15°, 15–25°, >25%); aspect map showing north/south-facing exposures for stormwater and vegetation planning; flagged 8 areas with anomalous slope breaks suggesting possible data artifacts
Example 3: Historical Change Detection
- Input: 1995 USGS topographic map vs. 2024 LIDAR survey
- Output: Elevation difference map highlighting 6 significant terrain changes; documented 3.2 feet of fill in commercial district and 1.8 feet of erosion in creek channel; confidence assessment and recommendations for field verification
What's Included
- SKILL.md instruction file: Complete guidance for elevation data workflows, contour validation, and standards compliance
- Elevation Data Checklist: Source evaluation matrix covering LIDAR, GPS surveys, and government datasets with accuracy requirements
- Contour Interval Selection Framework: Decision tree for choosing appropriate contour spacing based on terrain complexity, scale, and project type
- Quality Assurance Workflow: Step-by-step verification process including benchmark comparisons, anomaly detection, and standards compliance checks
- Stakeholder Communication Templates: Map annotation examples and terrain complexity explanation guides for planners and engineers
Who It's For
- Cartographers — Create USGS and government-compliant topographic products from raw elevation data with validated accuracy
- Urban planners — Assess terrain constraints and development suitability using slope analysis and hydrologic flow predictions
- Civil engineers — Verify elevation data quality and contour accuracy before design decisions affecting drainage and grading
- GIS analysts — Systematically process and validate elevation datasets from multiple sources for planning applications
- Landscape architects — Understand terrain complexity through accurate slope and aspect analysis for site design
Best For
- Extracting and validating elevation data from LIDAR, GPS surveys, and government sources
- Generating contour maps with geodetically accurate intervals appropriate to terrain complexity
- Creating slope analysis and aspect maps for development suitability assessment
- Identifying data anomalies, interpolation artifacts, and quality issues before they impact planning
- Comparing historical topographic surveys with current elevations to document land changes
- Ensuring topographic products meet USGS, NRCS, or local government standards and specifications
You might also like
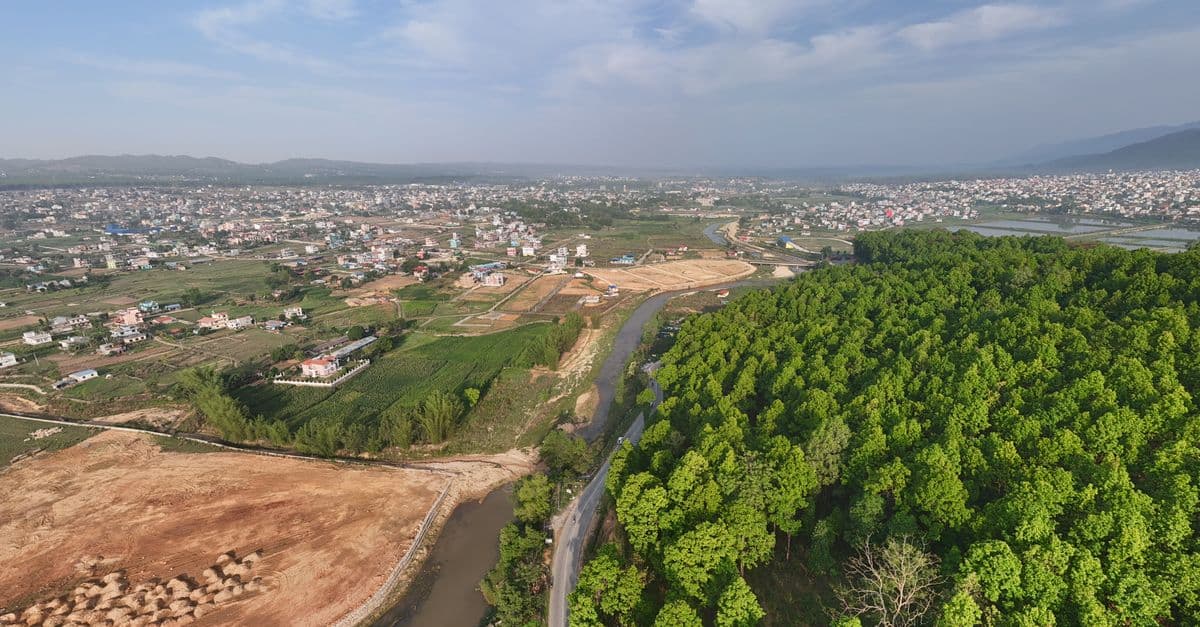
You can conduct comprehensive land use compatibility assessments that identify vertical and horizontal conflicts between proposed developments and surrounding uses. The skill helps you evaluate zoning compliance, assess adjacency impacts, document regulatory alignment, and develop evidence-based mitigation strategies that withstand planning commission and city council scrutiny.

You can synthesize coastal datasets (tide gauges, LIDAR, bathymetry, historical shorelines) to quantify erosion trends and sea-level rise impacts. Claude builds deterministic and probabilistic inundation projections, assesses infrastructure vulnerability, and translates technical analysis into policy-relevant findings that satisfy state coastal zone management and NEPA/CEQA compliance requirements for development approvals and adaptation investments.

This skill structures the variance analysis process to ensure consistency, reduce bias, and create audit trails that justify approvals or denials based on established legal standards. You'll generate comprehensive reports that document substantial difficulty claims, unique circumstances, hardship justifications, and condition frameworks that withstand administrative review and potential legal challenge.
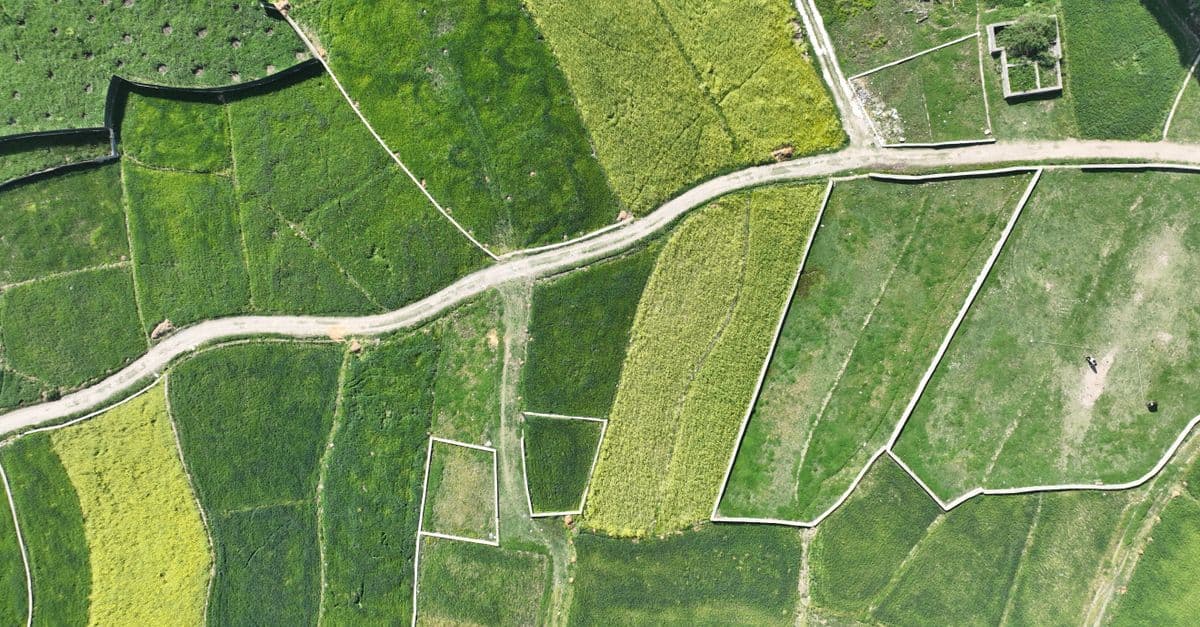
You can systematically design spatial analysis workflows that integrate vector data (zoning boundaries, infrastructure networks, parcel geometries) with raster datasets (elevation models, land use classifications, accessibility surfaces). The skill provides validation protocols to identify data resolution conflicts, projection misalignments, overlay logic errors, and output specification issues before analysis execution. You'll communicate complete analysis specifications to technical teams and stakeholders with confidence that the workflow methodology is sound.

This skill guides you through comprehensive environmental impact analysis using NEPA's analytical framework. You can evaluate direct, indirect, and cumulative effects across multiple resource categories (air quality, water resources, wildlife, cultural resources, socioeconomics), develop defensible mitigation measure hierarchies using the avoidance-minimization-compensation approach, and structure complex impact analyses across thousands of pages of EIS documentation while ensuring internal consistency and regulatory defensibility.

You can identify slow spatial queries, analyze PostGIS execution plans, design optimal spatial indexes (GIST, BRIN, SP-GIST), and restructure database schemas for efficient land use analysis, zoning verification, and infrastructure mapping. This skill helps you troubleshoot why intersection queries timeout, optimize buffer operations on large feature classes, and accelerate web mapping service delivery without requiring application code changes.

You can systematically design engagement strategies that move beyond checkbox consultation to genuine stakeholder co-creation. Claude helps you develop structured dialogue frameworks, identify underlying community concerns versus stated objections, anticipate conflicts between community priorities and project feasibility, and create communication materials that resonate across diverse education levels, languages, and media preferences. This skill guides you through multi-phase engagement planning, equity-focused participation design, and documentation of engagement quality for municipal approvals.

Transform violation complaints and site inspection data into standardized, defensible enforcement documentation. You can rapidly assess violation severity, establish reasonable remediation timelines, prioritize enforcement actions across multiple violations, and generate compliance agreements that protect jurisdictional authority. The skill structures your analysis to create documentation suitable for both negotiated compliance and formal enforcement proceedings.