


QSR Operational Analysis & Optimizer
Analyze QSR operations to find profit leaks and create actionable optimization plans

What You Can Do
Upload your P&L statements, labor schedules, and inventory data to get a detailed analysis of your restaurant's profitability. The skill identifies specific cost inefficiencies—from overstaffing periods to food waste and inventory misalignment—and creates prioritized action plans to improve margins. You'll receive concrete, implementable recommendations with expected ROI for each optimization.
Features
Break down revenue, COGS, labor, and operating expenses by category to identify which costs are driving inefficiency
Analyze staffing levels against customer traffic patterns and recommend schedule changes that reduce costs without impacting service
Identify COGS percentage abnormalities, track waste sources, and recommend portion control and prep adjustments
Balance inventory turns against stockout risk to free up working capital and reduce spoilage
Calculate break-even points for different revenue scenarios and cost structures to understand operational leverage
Compare your P&L metrics, labor percentage, and COGS against QSR industry standards for your segment
Ranked recommendations with implementation difficulty, timeline, and ROI projections for each initiative
Example Output
Labor Scheduling Optimization
Finding: Peak lunch hours show 15% overstaffing during slower 1-2pm window
Recommendation: Shift one full-time employee to evening prep (4-6pm)
- Current cost: $18/hr × 1 FTE × 5 days = $450/week
- Annual savings: $23,400
- Implementation: 2 weeks
Food Cost Leak Analysis
Finding: 4.2% of prepared food discarded daily (above 2.5% industry standard)
Root Causes: Over-portioning in 45% of menu items
- Corrected portions on 8 items = 1.8% waste reduction
- Annual food cost savings: $12,650
- No impact on customer satisfaction
Inventory Carrying Cost Reduction
Finding: Inventory turns = 8.2x annually (slow vs 12-15x for similar units)
Optimization: Shift to twice-weekly deliveries, reduce safety stock by 20%
- Freed up working capital: $8,400
- Annual carrying cost savings: $1,680
- Reduced spoilage through faster turnover
What's Included
- P&L Profitability Analysis: Full breakdown of revenue and all cost categories with variance analysis against industry benchmarks
- Labor Scheduling Assessment: Peak/off-peak staffing analysis with specific optimization recommendations to reduce labor costs
- Food Cost & Waste Report: COGS breakdown, waste tracking by item, and portion control recommendations
- Inventory Optimization Plan: Stock level analysis, inventory turn rate benchmarking, and working capital reduction strategies
- Prioritized Recommendation List: Top 5-10 actions ranked by ROI, implementation difficulty, and timeline
- Industry Benchmark Comparison: Side-by-side comparison of your metrics against QSR performance standards for your segment
Who It's For
- QSR General Managers
- Franchise Owners & Multi-Unit Operators
- Regional Operations Managers
- Restaurant Financial Controllers & CFOs
- QSR Management Consultants
Best For
- Identifying operational cost leaks and inefficiencies
- Benchmarking performance against industry standards
- Creating data-driven labor scheduling strategies
- Reducing food costs and waste through portion optimization
- Building multi-phase improvement roadmaps with clear ROI
You might also like
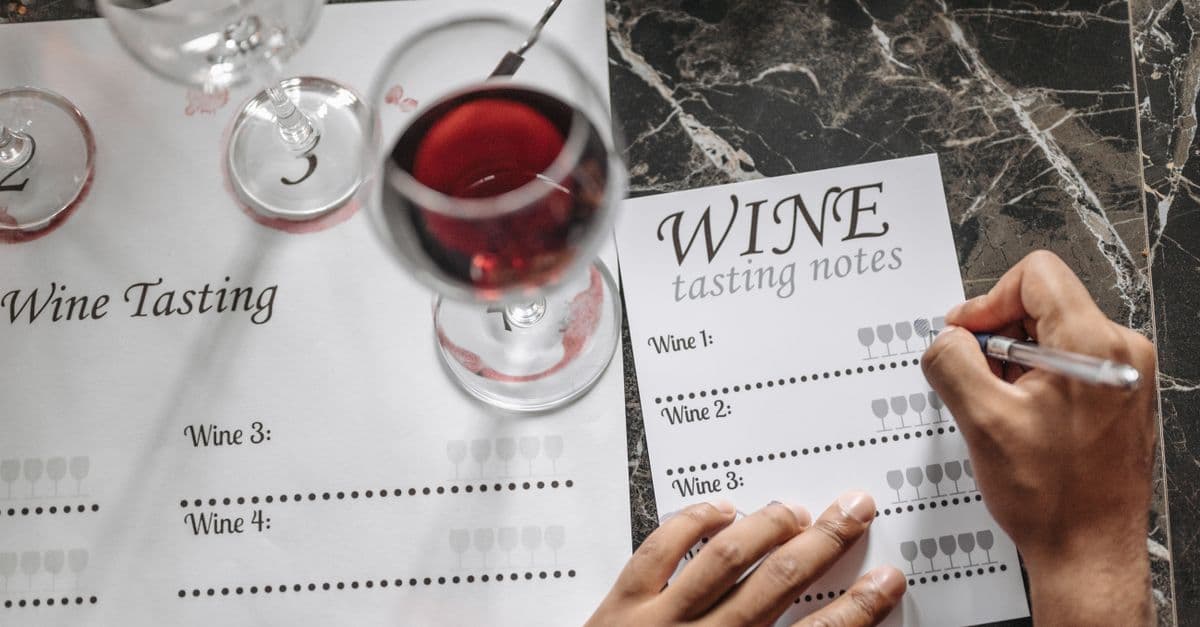
You can design balanced wine lists that maximize profitability while delighting guests, and you can develop comprehensive sommelier training programs tailored to your hotel's F&B strategy. The skill analyzes your current wine portfolio, guest demographics, and pricing targets to recommend specific wines, list structures, and service protocols that increase wine sales margins while maintaining guest satisfaction.

Create comprehensive, progressive wine tasting curricula tailored to your students' level, from novice to advanced. Generate standardized assessment rubrics that measure tasting proficiency objectively, and design blind tasting protocols that teach accurate varietal and region identification. Use these tools to build cohesive, measurable wine education programs that scale from small workshops to multi-year sommelier training.
Upload your food and beverage cost data and receive comprehensive variance analysis, trend identification, and actionable cost reduction recommendations. The skill automatically categorizes expenses, compares actual vs. budgeted costs, and generates clear reports highlighting areas of concern and opportunity. You get variance percentages, trends across periods, and specific remediation strategies all in one structured output.

Generate optimized weekly labor schedules that balance cost efficiency with legal compliance requirements. The skill automatically accounts for employee availability, labor law regulations (minimum wage, break requirements, scheduling rules by jurisdiction), and demand patterns to create schedules that reduce overtime and scheduling conflicts. You provide employee data, staffing requirements, and constraints—the skill delivers a schedule ready to deploy.

Craft comprehensive beverage programs tailored to your venue's concept, market position, and operational constraints. You'll analyze ingredient costs, build optimized cocktail menus, create training materials that empower staff upselling, and develop seasonal programming that drives revenue. This skill combines industry best practices with your specific data to deliver programs that increase margins, improve inventory efficiency, and build guest loyalty.

This skill analyzes your food and beverage costs against established standards, pinpointing variances and their root causes with quantified financial impact. You get detailed variance reports, root cause analysis, and prioritized corrective actions ranked by profitability impact. It's designed for restaurant managers, food service directors, and cost analysts who need to optimize F&B spending and quickly identify where money is leaking.
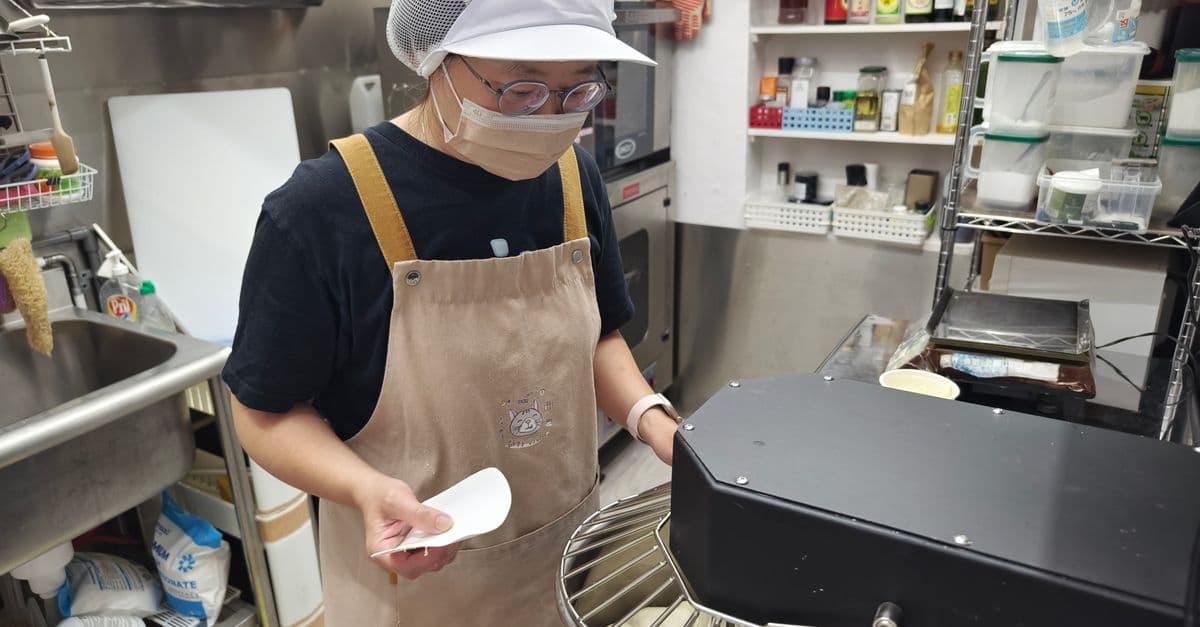
Standardize your recipes with precise instructions, ingredient lists, and portion guidance tailored to your kitchen's needs. Train your staff with structured protocols, quality control checklists, and food safety documentation. Generate cost analyses, workflow optimizations, and supplier coordination templates to streamline daily operations and reduce waste.

Generate comprehensive banquet event runsheets, minute-by-minute timelines, and detailed service choreography for events of any size. This skill orchestrates every element of banquet service—from staff assignments and vendor coordination to course timing and contingency triggers—reducing planning hours to minutes while ensuring flawless execution.