

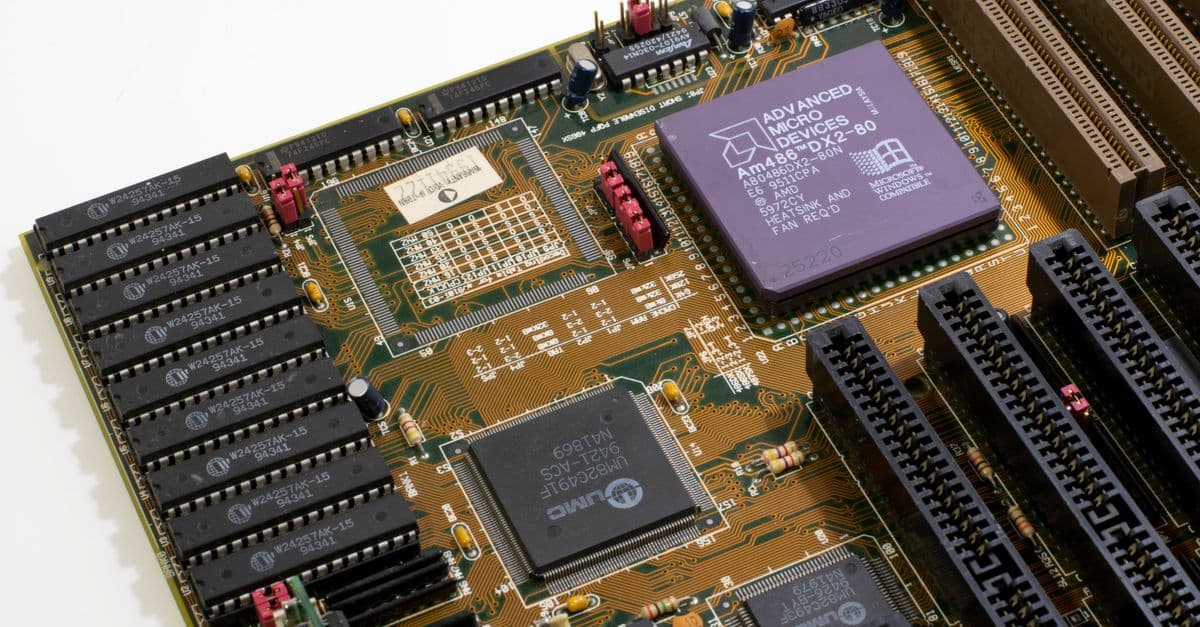
Semiconductor Process Optimization & Troubleshooting
Systematically optimize semiconductor yields through data-driven troubleshooting
What You Can Do
You can diagnose root causes of yield loss, identify process drift in real time, and optimize critical parameters using structured troubleshooting frameworks. The skill helps you prioritize corrective actions based on statistical analysis, accelerate problem resolution, and build repeatable optimization workflows that your team can execute consistently across production runs.
Features
Systematically identify which process steps, equipment, or parameter ranges drive yield losses using structured fault tree analysis and correlation mapping.
Detect subtle process shifts before they impact yield using control charts, trend analysis, and automated anomaly detection against historical baselines.
Analyze multi-factor interactions to identify which process parameters have the highest leverage on yield, defect rates, and product quality.
Set up factorial and fractional factorial experiments to validate hypotheses, quantify parameter sensitivity, and build predictive models for process improvements.
Categorize defect types by root cause, map failure modes to process conditions, and prioritize engineering controls that prevent recurrence.
Calculate Cpk, Ppk, and trend your process capability over time. Compare current performance against historical baselines and peer fab data to identify improvement opportunities.
Translate analysis into specific engineering actions with success criteria, rollback plans, and verification checkpoints for safe implementation.
Identify parameter correlations across multiple manufacturing lines to isolate whether issues are equipment-specific, lot-specific, or process-wide.
Example Output
Example 1: Yield Loss Root Cause Report
- 🎯 Primary Yield Driver: Lithography critical dimension (CD) drift
  • Photoresist flow rate: ↑ 8% over last 3 wafer runs → CD widening
  • Statistical correlation: r = 0.87 (CD vs. resist viscosity)
  • Recommended action: Adjust resist dispense calibration; expect +2.3% yield recovery

- 📊 Secondary Factor: Etch uniformity
  • Plasma power variation: ±12% (spec: ±5%)
  • Impact on CD variation: ±15nm (over-etch)
  • Verification checkpoint: Run DOE with ±10% power window
Example 2: Process Drift Detection Alert
- ⚠️ Process Control Status: Out of Statistical Control
  • Control chart: 3 consecutive points beyond µ ± 2σ (resist thickness)
  • Trend: Gradual increase +0.3 µm over 8 hours
  • Root cause hypothesis: Spin speed encoder drift or resist aged
  • Immediate action: Calibrate spin equipment; pull resist batch expiration
  • Verification: Re-run SPC after maintenance; confirm return to control
Example 3: DOE Recommendations
- 📈 Factorial Design Results (Etch Parameter Optimization)
  • Main effects: Plasma power (65% impact) > Pressure (22%) > Time (8%) > Gas ratio (5%)
  • Optimal window: 800W ± 25W, 2.5 Pa ± 0.2 Pa
  • Expected yield improvement: +4.1% (95% confidence)
  • Interaction risk: Power × Pressure (p < 0.05) — test edge cases before full rollout
What's Included
- Root Cause Analysis Framework: Structured templates and decision trees to diagnose yield loss triggers, including fault tree mapping, statistical correlation analysis, and hypothesis prioritization.
- Statistical Process Control (SPC) Templates: Pre-built control chart workflows, capability metrics (Cpk, Ppk), and automated anomaly detection to catch process drift early.
- Design-of-Experiments (DOE) Playbook: Step-by-step guidance for factorial designs, fractional factorials, and response surface methods with interpretation of interaction effects and confidence bounds.
- Parameter Optimization Workflow: Data-driven methods to map parameter interactions, identify critical thresholds, and recommend specific setpoint adjustments with expected yield impact.
- Defect Classification & Failure Mode Checklist: Categorization framework linking defect morphology to process conditions, with root cause prioritization and mitigation strategies.
- Implementation Runbooks: Actionable recommendations with rollback plans, success criteria, and verification checkpoints for safe deployment to production.
Who It's For
- Process Engineers
- Manufacturing Engineers
- Quality Engineers
- Fab Operations Managers
- Semiconductor Device Technologists
Best For
- Investigating yield excursions and sudden defect spikes
- Optimizing critical process parameters (temperature, pressure, flow, voltage)
- Detecting and correcting process drift before quality impact
- Running Design-of-Experiments to validate process improvements
- Building repeatable troubleshooting workflows across fab lines
You might also like

This skill analyzes scripts or project briefs and generates comprehensive production breakdowns that guide your entire shoot. You get detailed shooting schedules, budget estimates by department, crew requirements, location specs, and risk assessments all from a single script. Use it to plan productions at any scale, from independent projects to studio features, and catch problems before they become expensive.
 by kylezantos
Prepare comprehensive audit documentation, track non-conformance issues from identification through resolution, and generate corrective action plans. You can document audit findings, prioritize risks by severity, assign accountability, and create formal reports that demonstrate compliance readiness to auditors and stakeholders.
by kylezantos
You can build interactive UI components with purposeful motion—transitions, hover states, micro-interactions, and enter/exit animations—or audit existing motion design and receive detailed feedback. The skill operates in two focused modes: Create mode helps you implement motion that serves a clear purpose, while Audit mode evaluates your animations against industry-standard principles and reports specific findings with improvement recommendations.
by kylezantos
You'll develop comprehensive 5S implementation strategies, conduct workplace audits with structured scoring, generate standardized procedures for your team, and facilitate continuous improvement cycles. Claude analyzes your current state, identifies quick wins, and helps you build lasting lean culture through data-driven assessments and kaizen guidance.
by kylezantos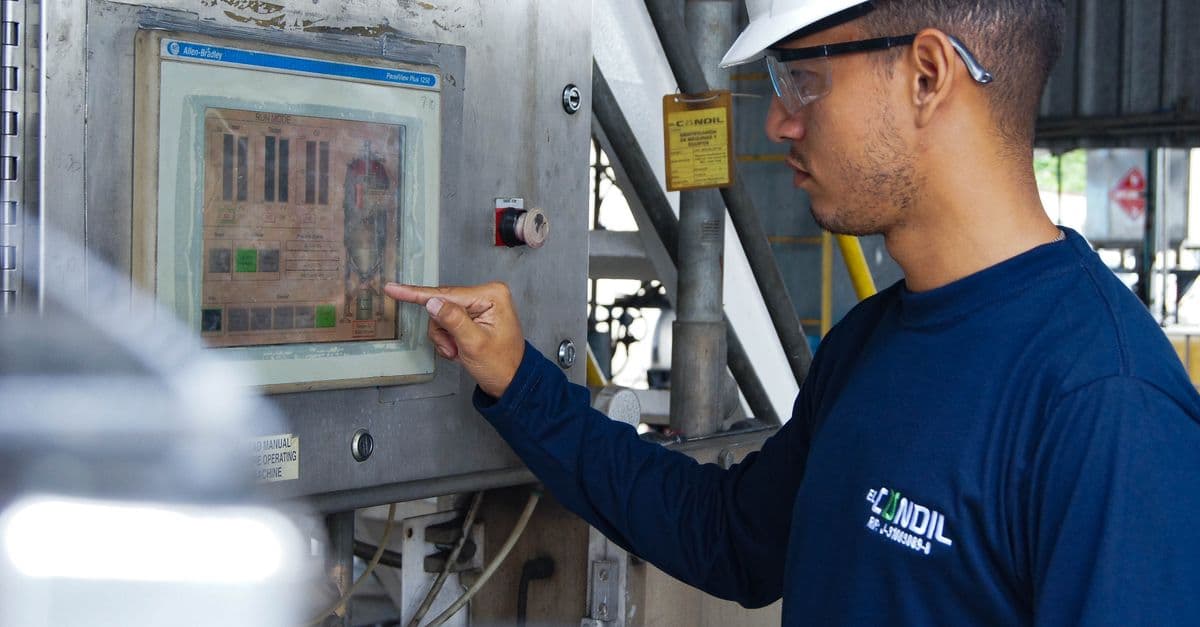
You can systematically identify root causes of production problems using proven troubleshooting frameworks, decision trees, and rapid diagnosis protocols. This skill walks you through impact assessment, root cause analysis, and solution validation to minimize downtime and prevent recurring issues in manufacturing and operations environments.
by kylezantos
You can leverage Claude to streamline every aspect of film production coordination—from managing crew schedules and budgets to troubleshooting on-set logistics and creative challenges. This skill helps you create call sheets, coordinate locations, track production expenses, and quickly solve problems that arise during shooting without disrupting your workflow.
by kylezantos
You provide production data and process details, and this skill systematically analyzes the information to identify root causes of quality issues, yield losses, or equipment failures. It develops prioritized corrective actions with implementation timelines, compliance documentation, and performance metrics to track improvement effectiveness.
by kylezantos
This skill applies structured decision logic to classify, prioritize, and route manufacturing or post-production defects with consistency and evidence-based reasoning. You provide defect details, and Claude triages them into severity categories, recommends dispositions (scrap, rework, accept-as-is, hold), and documents the decision logic so your quality team can audit, adjust rules, and track trends over time.
by kylezantos