

GPU Bottleneck Analyzer
Diagnose GPU bottlenecks and generate targeted optimization strategies from profiling data
What You Can Do
You can upload GPU profiling data from tools like PIX, RenderDoc, or Android GPU Inspector and receive detailed bottleneck diagnosis pinpointing whether your performance constraint is vertex processing, rasterization, pixel shaders, memory bandwidth, or texture cache thrashing. Claude analyzes your specific metrics against platform-specific GPU architecture limitations and generates prioritized optimization recommendations with estimated performance impact and implementation complexity.
Features
Automatically categorizes performance constraints across vertex, rasterization, pixel shader, and memory bandwidth domains
Evaluates shader code for redundant computation, suboptimal texture sampling patterns, and unnecessary precision requirements
Identifies texture cache thrashing, bandwidth saturation, and VRAM allocation inefficiencies specific to your GPU architecture
Accounts for PC, console, and mobile GPU architecture differences when recommending strategies
Ranks optimization opportunities by estimated performance gain versus implementation effort
Analyzes rendering pipeline configuration for inefficient batching, state changes, and resource binding patterns
Calculates frame budget allocations for different GPU workload categories based on your target frame rate and resolution
Example Output
Input: PIX trace showing 8ms GPU time at 1440p60 (16.67ms budget)
Output:
PRIMARY BOTTLENECK: Pixel Shader (62% of GPU time)
- G-Buffer passes consuming 5.1ms due to redundant normal calculations
- Deferred lighting with 256 dynamic lights causing 2.8ms texture bandwidth spike

RECOMMENDED OPTIMIZATIONS:
1. [HIGH ROI] Compress normal maps to R8G8 + reconstruct Z (est. 1.2ms gain)
2. [MEDIUM ROI] Implement light culling grid to reduce per-pixel light count (est. 0.8ms gain)
3. [LOW ROI] Reduce shadow map resolution from 2048 to 1024 for distant lights (est. 0.3ms gain)

ESTIMATED RESULT: 7.0ms GPU time (2ms headroom for future content)
What's Included
- SKILL.md instruction file with GPU profiling best practices and metric interpretation guide:
- Profiling Data Template: structured format for organizing metrics from PIX, RenderDoc, and mobile profilers
- Bottleneck Decision Tree: diagnostic flowchart for identifying constraint types from key metrics
- Shader Optimization Checklist: common patterns (ALU vs. bandwidth, precision reduction, texture sampling efficiency)
- Platform GPU Specification Reference: architecture details for PC (NVIDIA/AMD), console (PS5/Xbox Series X), and mobile (Qualcomm/Mali/PowerVR) with memory hierarchy characteristics
Who It's For
- Technical Artists — optimizing rendering pipelines and shader performance for shipped quality targets
- Graphics Programmers — diagnosing GPU bottlenecks during optimization passes and profiling-driven development
- Game Optimization Engineers — managing frame budget allocation across multiple rendering features and platforms
- Performance-Focused Leads — directing optimization priorities based on ROI and platform constraints
- Mobile Game Developers — optimizing for fragmented GPU landscape and limited memory bandwidth constraints
Best For
- Analyzing profiling data from PIX, RenderDoc, Xcode Instruments, and Android GPU Inspector
- Diagnosing whether GPU bottlenecks are in vertex processing, rasterization, pixel shaders, or memory bandwidth
- Generating prioritized optimization strategies with performance impact estimates
- Evaluating shader code for redundant computation and suboptimal resource usage
- Setting platform-specific frame budget targets for different GPU architectures
You might also like

You'll convert game design briefs into comprehensive visual direction documents that guide concept artists and 3D modelers through pre-production. This skill generates aesthetic frameworks, curates style references, specifies character and environment requirements, documents technical constraints, and produces mood board descriptions—all formatted for immediate team alignment and reference during production. Instead of iterating through clarifying questions, you'll have structured documentation that translates vague creative intent into actionable visual guidelines.

You'll develop dynamic music systems using layered composition, state mapping, and parameter control. This skill teaches you to design vertical remixing (adding/removing musical layers) and horizontal sequencing (transitioning between musical sequences) based on game conditions. You'll create clear technical specifications that bridge creative composition and programmer implementation, enabling music that adapts seamlessly to player actions, environmental shifts, and gameplay intensity.
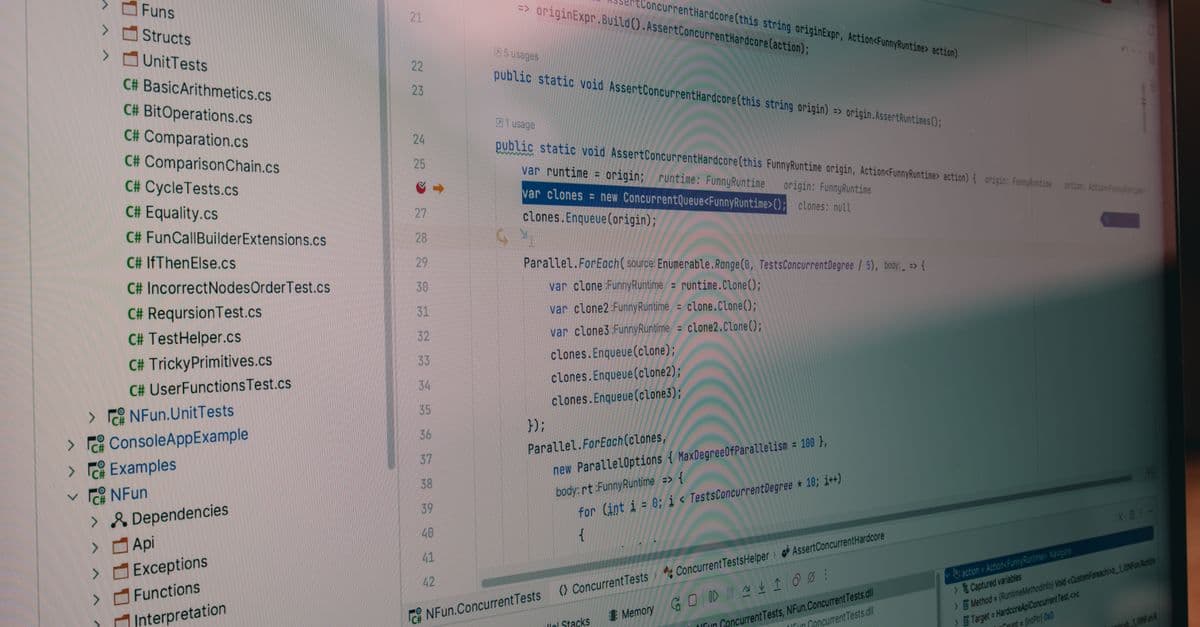
You can analyze shader compilation logs across multiple graphics APIs, automatically detect common shader errors and cross-platform compatibility issues, and receive actionable optimization recommendations for your studio's shader build infrastructure. Claude helps you identify performance regressions, validate that new shader code meets performance targets, and document compilation requirements for team onboarding—turning complex multi-API shader validation into a systematic, repeatable process.

Get a step-by-step launch strategy tailored to your specific business model. This skill analyzes your offering, target market, and resources to create a realistic, phased launch plan with timing, marketing tactics, and success metrics. You'll receive competitor analysis, positioning recommendations, and a 90-day execution roadmap.

You can upload profiling data, flame graphs, or performance metrics from your game engine and receive systematic analysis of bottlenecks. Claude identifies root causes by cross-referencing metrics against common engine patterns, reveals cascading performance issues, and delivers production-ready code solutions with clear trade-offs for each optimization approach.

You can input high-level design direction—like 'grimdark knight commander' or 'bioluminescent forest'—and receive comprehensive visual briefs that include mood references, silhouette guidelines, color palettes, pose suggestions, and thematic specifications. This skill generates structured design documentation that guides your concept art pipeline, reduces revision cycles, and ensures all team members work from the same artistic vision.

You can systematize pixel art animation organization by analyzing your game's animation requirements, calculating optimal sprite sheet dimensions, planning color palette strategies, and generating frame sequence documentation. Claude helps you move from manual guesswork to data-driven asset optimization, reducing revisions during engine integration and saving hours on layout iterations.

You can model complex in-game economies by describing currency flows, progression curves, and monetization systems in natural language, then have Claude validate the math, simulate outcomes across player cohorts (free players, mid-tier spenders, whales), identify inflation breakpoints, and stress-test against exploits. This lets you iterate on balance rapidly without building spreadsheets, catching economy-breaking issues before they damage retention.