


S&OP Demand Consensus Builder
Build S&OP consensus from demand forecasts with data-driven narratives

What You Can Do
Analyze demand forecasts from multiple stakeholders, identify conflicts and gaps, and generate consensus narratives backed by data. You'll transform scattered forecasts into unified S&OP strategies that align sales, operations, and finance. The skill prepares you to facilitate stakeholder consensus and make data-driven supply chain decisions.
Features
Consolidate demand forecasts from sales, marketing, and operations to identify variance and sources of disagreement
Automatically map each stakeholder's forecast assumptions, constraints, and reasoning to surface hidden conflicts
Score consensus levels across forecasts, identify outliers, and highlight areas requiring deeper discussion
Create executive S&OP narratives that explain forecast decisions with supporting data and business context
Identify upside/downside risks in consensus forecasts and develop contingency scenarios with financial impact
Generate S&OP agenda items, talking points, and decision frameworks ready for executive review
Rank supply chain decisions by impact, urgency, and alignment with business strategy
Example Output
Example 1: Consensus Summary
Demand Forecast Consensus (Q3 2026)
- Consensus Forecast: 487K units (+12% YoY)
- Forecast Range: Sales 510K | Ops 460K | Finance 485K
- Variance: ±5% (Low consensus risk)
- Key Driver: Seasonal promotion uptick (Sales +8% assumption)
Recommended Action: Increase inventory buffer by 15K units to hedge promotion uncertainty
Example 2: Stakeholder Gap Analysis
| Stakeholder | Forecast | Confidence | Key Assumption | Risk |
|---|---|---|---|---|
| Sales | 510K | 75% | Promo success +8% | Channel partner delays |
| Operations | 460K | 85% | Historical trend line | Capacity constraint at 450K |
| Finance | 485K | 80% | Conservative blended | Working capital impact $2.1M |
Consensus Path: Recommend 485K baseline + 20K promotional upside with phased production
Example 3: S&OP Narrative Extract
"Q3 demand consensus stands at 485K units, representing 12% growth. While sales projects 510K driven by promotional activity, operations recommends 460K based on capacity. Finance's 485K estimate balances growth opportunity against working capital constraints. We recommend a 485K baseline plan with 20K promotional upside, contingent on customer pre-orders by August 15th."
What's Included
- Demand reconciliation framework: Step-by-step process to consolidate multi-stakeholder forecasts and calculate consensus metrics
- Consensus scoring model: Quantitative approach to measure forecast alignment and identify outlier assumptions
- S&OP narrative template: Executive-ready template for writing consensus narratives with data integration points
- Risk and scenario builder: Framework for identifying supply chain risks and developing upside/downside contingency plans
- Pre-read generator: Tool to create S&OP agenda items, decision frameworks, and discussion guides for leadership reviews
- Recommendation framework: Prioritization matrix for supply chain decisions with financial impact modeling
Who It's For
- S&OP and demand planning managers
- Supply chain executives
- Finance and operations controllers
- Sales and revenue planners
- Production and inventory planners
Best For
- Preparing S&OP pre-read materials
- Building consensus across demand forecasts
- Analyzing forecast variance and root causes
- Developing supply chain contingency scenarios
- Creating executive S&OP narratives
You might also like

You'll create comprehensive, data-driven vendor negotiation briefs that synthesize vendor background, pricing history, market position, and negotiation leverage into a concise, actionable brief. The skill analyzes your vendor context and generates talking points, risk assessments, and strategic recommendations tailored to your negotiation objectives.

You can map your entire supply chain network, identify bottlenecks and inefficiencies, and model optimization scenarios. This skill helps you visualize supplier relationships, distribution channels, and logistics flows to find cost savings and reduce delivery times. You'll get actionable recommendations backed by network analysis and scenario modeling.

You can analyze cycle count discrepancies in detail, identifying why variances occurred and their impact on inventory accuracy. The skill systematically investigates variances, pinpoints root causes (data entry errors, shrinkage, misplacement, system sync issues), and generates targeted corrective action plans with measurable outcomes to prevent recurrence.

You can feed support ticket data, interaction logs, and customer engagement metrics into Claude, which automatically surfaces churn risk signals—declining engagement patterns, sentiment shifts toward frustration, feature adoption gaps, and escalation trajectories. Claude generates risk scores (Critical/High/Medium/Low) with specific evidence and recommends targeted interventions before customers reach the cancellation stage.

This skill quickly analyzes inventory discrepancies from cycle counts, pinpoints the likely root causes, and recommends specific corrective actions to improve accuracy. You can upload count data, review detailed variance breakdowns by location or SKU, and get actionable insights to close gaps in your inventory management.

You can analyze supplier performance across multiple dimensions, identify improvement opportunities, and develop collaborative action plans that strengthen your supply chain. Claude evaluates supplier capabilities, financial health, delivery performance, and quality metrics to surface risks early, then structures targeted development initiatives that drive mutual value creation and reduce supply chain vulnerability.
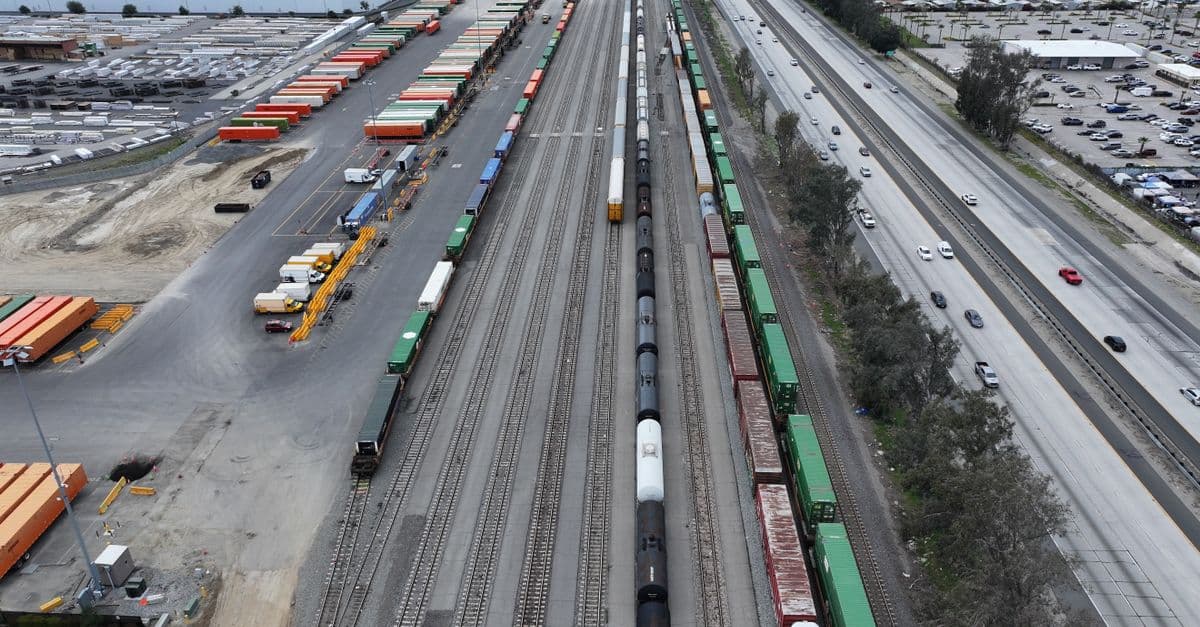
This skill analyzes complex supply chain networks to identify optimization opportunities across cost, service levels, and environmental impact. You can model network changes, evaluate supplier alternatives, and forecast the impact of disruptions before implementation. It provides data-driven recommendations for network redesign, inventory rebalancing, carrier selection, and sustainability improvements.
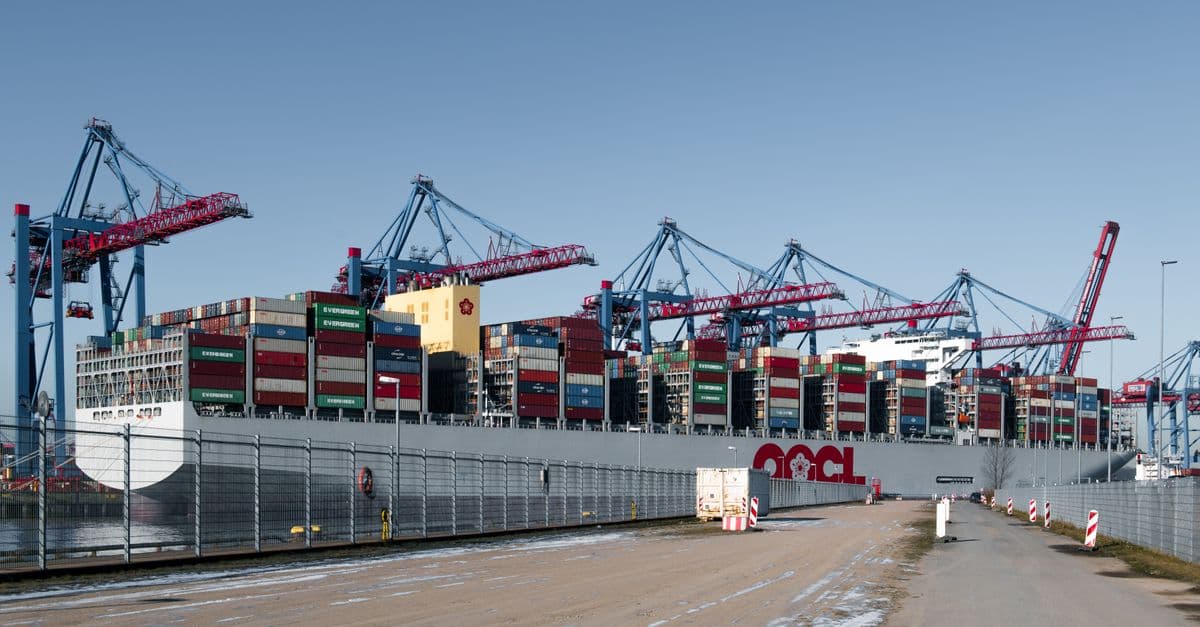
You can analyze shipping expenses across multiple carriers, identify cost-saving opportunities, and evaluate carrier performance metrics to reduce logistics expenses. The skill compares rates, delivery times, reliability scores, and service quality to help you negotiate better contracts and make data-driven carrier selection decisions.