


Pumped Hydro System Optimization & Diagnostics
Analyze pumped hydro facility performance and optimize round-trip efficiency
What You Can Do
You can systematically analyze pumped hydro facility performance data to pinpoint efficiency losses, calculate head losses and mechanical degradation impacts, and generate prioritized maintenance and optimization recommendations. This skill synthesizes operational metrics, equipment specifications, and hydraulic calculations to quantify the financial impact of performance degradation and justify capital expenditures for modernization or intervention.
Features
Calculates system-wide efficiency losses across pump and turbine cycles to identify performance gaps against design specifications
Computes pressure and friction losses through intake, penstock, turbine, and tailrace systems using hydraulic engineering principles
Maps actual operating points against manufacturer performance curves to detect cavitation risk, off-design operation, and component degradation
Models efficiency recovery potential and ROI for specific maintenance interventions (bearing replacement, impeller refurbishment, seal upgrades)
Analyzes pump-to-turbine transition protocols and cycle scheduling to maximize grid stability while preserving component life
Evaluates facility performance against industry standards and peer facility data to contextualize findings
Links operational anomalies (cavitation, excessive vibration, thermal signatures) to hydraulic and mechanical root causes
Factors in environmental flow requirements, grid stability mandates, and seasonal operational limitations into optimization scenarios
Example Output
Example 1: Efficiency Audit Report
Facility: Upper/Lower Reservoir System, 100 MW capacity
- Current round-trip efficiency: 82.3% (design spec: 85.5%)
- Primary bottleneck: Turbine runner cavitation at high head, 2.1% efficiency loss
- Secondary loss: Penstock friction exceeding design assumptions by 12%, 1.1% loss
- Recommendation: Turbine runner polishing (3-week maintenance window) + penstock inspection for internal corrosion
- Expected efficiency recovery: 3.0% → ROI breakeven in 2.3 years
Example 2: Maintenance Prioritization
| Component | Degradation | Efficiency Impact | Timeline | Est. Cost |
|---|---|---|---|---|
| Pump bearing seals | High wear | 0.8% loss | Next 6 months | $45K |
| Turbine wicket gates | Cavitation scars | 1.2% loss | Next 12 months | $120K |
| Penstock coating | Corrosion spots | 0.3% loss | Next 24 months | $85K |
Example 3: Dispatch Optimization
Current protocol: Start turbine at 60% flow Optimized protocol: Staged turbine start with variable guide vane sequencing
- Efficiency gain: 1.4% over 8 cycles/day
- Cavitation risk reduction: 23%
- Grid ramp-rate compatibility: Maintained
What's Included
- SKILL.md instruction file with performance analysis framework:
- Efficiency audit checklist: operational data points, equipment specs, and calculations required
- Head loss calculation template: penstock friction, intake/tailrace losses, component-by-component breakdown
- Maintenance impact scorecard: ROI model, downtime analysis, and efficiency recovery forecasting
- Pump-turbine performance curve worksheet: operating point mapping and cavitation risk assessment tool
Who It's For
- Renewable energy engineers — optimizing pumped hydro facility performance and efficiency
- Hydroelectric facility operators — diagnosing performance degradation and planning maintenance schedules
- Energy storage project managers — evaluating capital expenditures for modernization and component upgrades
- Grid operations specialists — analyzing dispatch decisions and round-trip efficiency impacts on grid economics
- Power plant asset managers — benchmarking facility performance and justifying maintenance budgets
Best For
- Quarterly and annual efficiency audits of pumped hydro facilities
- Root cause analysis of unexplained power output losses or performance degradation
- Maintenance window planning with economic trade-off analysis and ROI forecasting
- Pump-to-turbine transition protocol optimization and dispatch decision support
- Comparative benchmarking against industry standards and peer facility performance data
You might also like
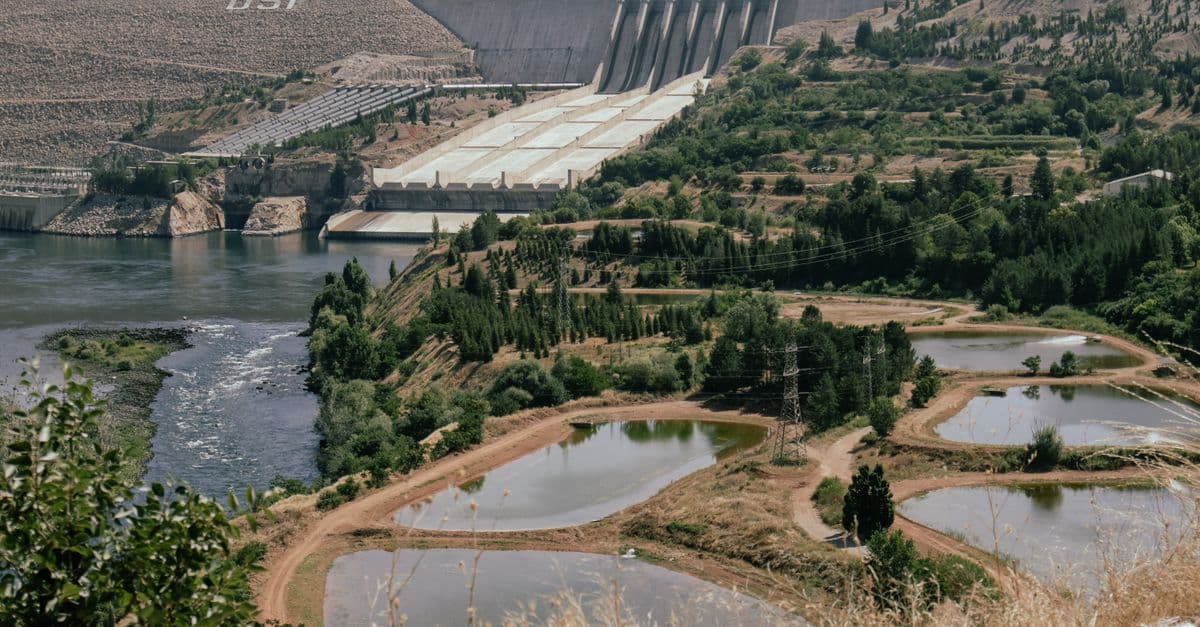
You can rapidly prototype pumped hydro storage systems by performing gross head calculations from topographic data, optimizing reservoir dimensions for target storage durations, and selecting appropriately sized pump-turbine units. Claude guides you through penstock diameter optimization, validates operating points against IEC and IEEE standards, and generates preliminary civil works estimates and equipment specifications ready for stakeholder review or financing submissions.
 by devsoul2026
You can design robust geothermal wellbores that withstand extreme thermal gradients, high-temperature steam zones, and corrosive geothermal fluids over multi-decade production lifecycles. This skill guides you through modeling accurate temperature profiles, selecting thermally-stable casing programs, choosing drilling fluids for elevated temperatures, and calculating pressure regimes that account for hydrostatic, lithostatic, and thermal stresses. The result is engineered wellbore designs that maximize resource contact while maintaining long-term integrity and regulatory compliance.
by devsoul2026
You can develop complete wellbore architecture designs for geothermal fields by integrating formation characteristics, drilling constraints, and production objectives. The skill guides you through casing program optimization, deviated well planning, high-temperature environment design, and trade-off analysis to balance thermal access against drilling cost and risk—critical for wells operating 20-50+ years in demanding subsurface conditions.
by devsoul2026
You can diagnose mechanical faults (bearing wear, imbalance, misalignment), electrical issues (converter harmonics, magnetic suspension drift), and energy losses (windage, friction, core) in operational flywheel systems. This skill interprets vibration data, bearing temperature anomalies, and power output degradation to pinpoint root causes and recommend corrective actions. You'll optimize charge/discharge cycles, predict maintenance windows, and validate designs against grid compliance requirements.
by devsoul2026
You can rapidly generate optimized PV system designs that synthesize site characteristics, equipment specifications, electrical standards, and performance requirements into actionable array layouts and electrical configurations. This skill accelerates design iteration by systematically evaluating competing constraints—energy capture maximization, electrical loss minimization, grid code compliance, thermal management, and cost optimization—without replacing professional engineering judgment, ensuring designs align with industry best practices.
by devsoul2026
You can assess whether your compensation packages are competitive in the current market by comparing base salary, bonus targets, equity grants, and total benefits against peer company data. The skill identifies pay band drift, flags retention risks, and generates specific adjustment recommendations to improve offer acceptance rates and reduce turnover exposure for roles from individual contributors to senior leadership.
by devsoul2026
You can use Claude to evaluate turbine placement concepts, quantify wake losses across layout scenarios, assess feasibility against site constraints, and identify optimization opportunities before detailed engineering. Claude helps you compare competing layouts, document design decisions, and troubleshoot yield predictions by analyzing wake interaction patterns and cost-benefit tradeoffs.
by devsoul2026
You can input formation data, drilling fluid specifications, temperature gradients, and stress regimes to receive actionable wellbore design recommendations and risk assessments. The skill evaluates alternative well trajectories, casing programs, and drilling fluid systems specifically for geothermal conditions (150-400°C), helping you minimize non-productive time and maximize thermal productivity while navigating the unique constraints of deep, high-temperature drilling operations.
by devsoul2026