


MRP/ERP Inventory Optimization & Analysis
Optimize inventory decisions and forecast demand with AI-powered MRP/ERP analysis

What You Can Do
Get instant analysis of safety stock levels, demand forecasts, supplier performance, and bill-of-materials optimization. You can reduce carrying costs by 15-25% while maintaining service levels, accelerate replenishment decisions with data-driven recommendations, and identify supply chain inefficiencies that impact cost and delivery performance.
Features
Calculate optimal safety stock levels based on demand variability, lead time uncertainty, and your target service level to minimize excess inventory while preventing stockouts.
Analyze historical sales patterns, seasonal trends, and market data to generate accurate demand forecasts that inform procurement and production planning.
Evaluate bill-of-materials structures for cost reduction opportunities, component consolidation, and alternative supplier options without compromising quality.
Benchmark suppliers across on-time delivery, quality metrics, lead times, and pricing to identify top performers and negotiate better terms with underperformers.
Determine optimal reorder points and economic order quantities (EOQ) that balance holding costs, ordering costs, and service level requirements for each SKU.
Compare FIFO, LIFO, and weighted-average cost methods to optimize tax liability, financial reporting, and identify the most cost-effective valuation approach for your product mix.
Classify inventory by value contribution and manage A, B, and C items with appropriate service levels and control strategies to optimize working capital.
Example Output
Safety Stock Recommendation:
- SKU XYZ-001: Current: 85 units | Recommended: 120 units | Carrying cost impact: +$240/year | Stockout risk reduction: 40%
- Lead time variability coefficient: 0.28 | Demand CV: 0.35 | Service level target: 95%
Demand Forecast (Next 12 Weeks):
| Week | Forecast | Confidence | Recommendation |
|---|---|---|---|
| 1-4 | 450 units | High (±8%) | Maintain current stock |
| 5-8 | 620 units | Medium (±14%) | Pre-order 200 units |
| 9-12 | 380 units | Medium (±12%) | Reduce weekly orders |
Supplier Performance Scorecard:
| Supplier | On-time % | Quality | Lead time | Price | Overall |
|---|---|---|---|---|---|
| Vendor A | 94% | 99.2% | 12 days | $24/unit | 8.6/10 |
| Vendor B | 87% | 97.1% | 18 days | $22/unit | 7.2/10 |
What's Included
- Demand Forecasting Templates: Ready-to-use analysis formats for time-series forecasting, seasonal decomposition, and trend analysis with guidance on forecast accuracy metrics.
- Safety Stock Calculator: Interactive tool to compute optimal safety stock using service level targets, demand/lead time variability, and cost-benefit analysis.
- BOM Optimization Framework: Structured approach to analyze component costs, identify consolidation opportunities, and evaluate alternative materials or suppliers.
- Supplier Performance Analytics: Multi-dimensional scoring model evaluating on-time delivery, quality, lead times, pricing, and responsiveness for data-driven vendor management.
- Inventory Metrics Dashboard: Comprehensive KPI framework including inventory turnover, days inventory outstanding, carrying cost ratio, and fill rates.
- Optimization Recommendations Report: Actionable summary identifying quick wins (cost reductions, efficiency gains) and strategic improvements ranked by impact and effort.
Who It's For
- Supply Chain Manager
- Procurement Manager
- Operations Manager
- Inventory Analyst
- Production Planner
Best For
- Reducing safety stock and carrying costs
- Improving demand forecast accuracy
- Supplier performance evaluation and negotiation
- Bill-of-materials cost optimization
- Optimizing reorder points and economic order quantities
You might also like

You'll create comprehensive, data-driven vendor negotiation briefs that synthesize vendor background, pricing history, market position, and negotiation leverage into a concise, actionable brief. The skill analyzes your vendor context and generates talking points, risk assessments, and strategic recommendations tailored to your negotiation objectives.

You can map your entire supply chain network, identify bottlenecks and inefficiencies, and model optimization scenarios. This skill helps you visualize supplier relationships, distribution channels, and logistics flows to find cost savings and reduce delivery times. You'll get actionable recommendations backed by network analysis and scenario modeling.

You can analyze cycle count discrepancies in detail, identifying why variances occurred and their impact on inventory accuracy. The skill systematically investigates variances, pinpoints root causes (data entry errors, shrinkage, misplacement, system sync issues), and generates targeted corrective action plans with measurable outcomes to prevent recurrence.

You can feed support ticket data, interaction logs, and customer engagement metrics into Claude, which automatically surfaces churn risk signals—declining engagement patterns, sentiment shifts toward frustration, feature adoption gaps, and escalation trajectories. Claude generates risk scores (Critical/High/Medium/Low) with specific evidence and recommends targeted interventions before customers reach the cancellation stage.

This skill quickly analyzes inventory discrepancies from cycle counts, pinpoints the likely root causes, and recommends specific corrective actions to improve accuracy. You can upload count data, review detailed variance breakdowns by location or SKU, and get actionable insights to close gaps in your inventory management.

You can analyze supplier performance across multiple dimensions, identify improvement opportunities, and develop collaborative action plans that strengthen your supply chain. Claude evaluates supplier capabilities, financial health, delivery performance, and quality metrics to surface risks early, then structures targeted development initiatives that drive mutual value creation and reduce supply chain vulnerability.
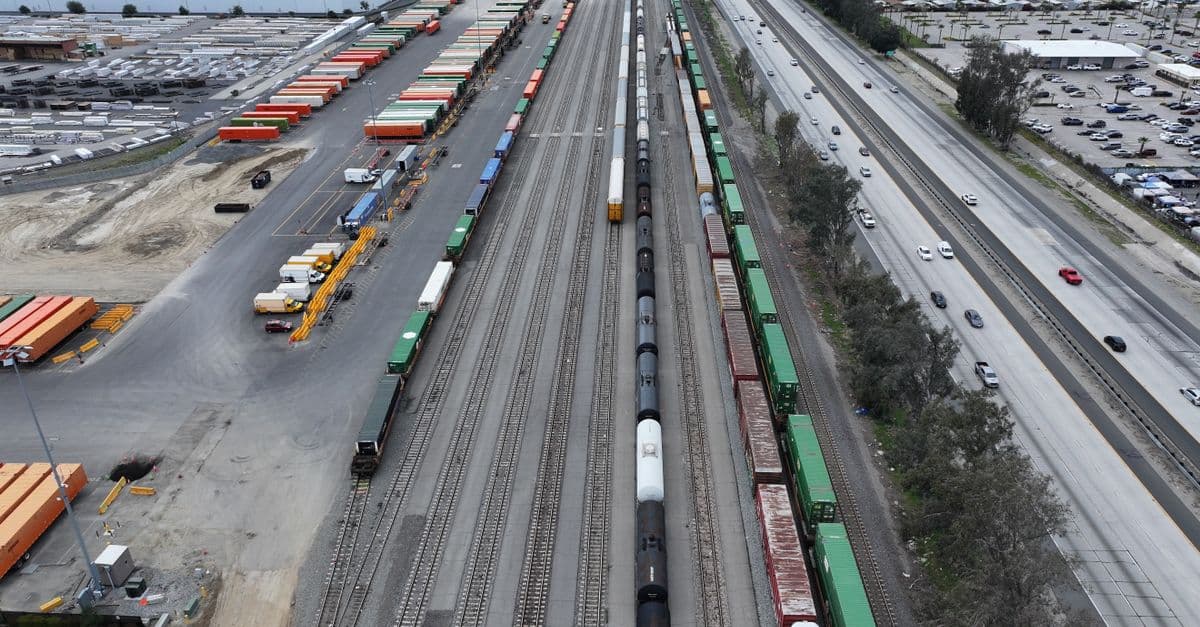
This skill analyzes complex supply chain networks to identify optimization opportunities across cost, service levels, and environmental impact. You can model network changes, evaluate supplier alternatives, and forecast the impact of disruptions before implementation. It provides data-driven recommendations for network redesign, inventory rebalancing, carrier selection, and sustainability improvements.

You can analyze shipping expenses across multiple carriers, identify cost-saving opportunities, and evaluate carrier performance metrics to reduce logistics expenses. The skill compares rates, delivery times, reliability scores, and service quality to help you negotiate better contracts and make data-driven carrier selection decisions.