

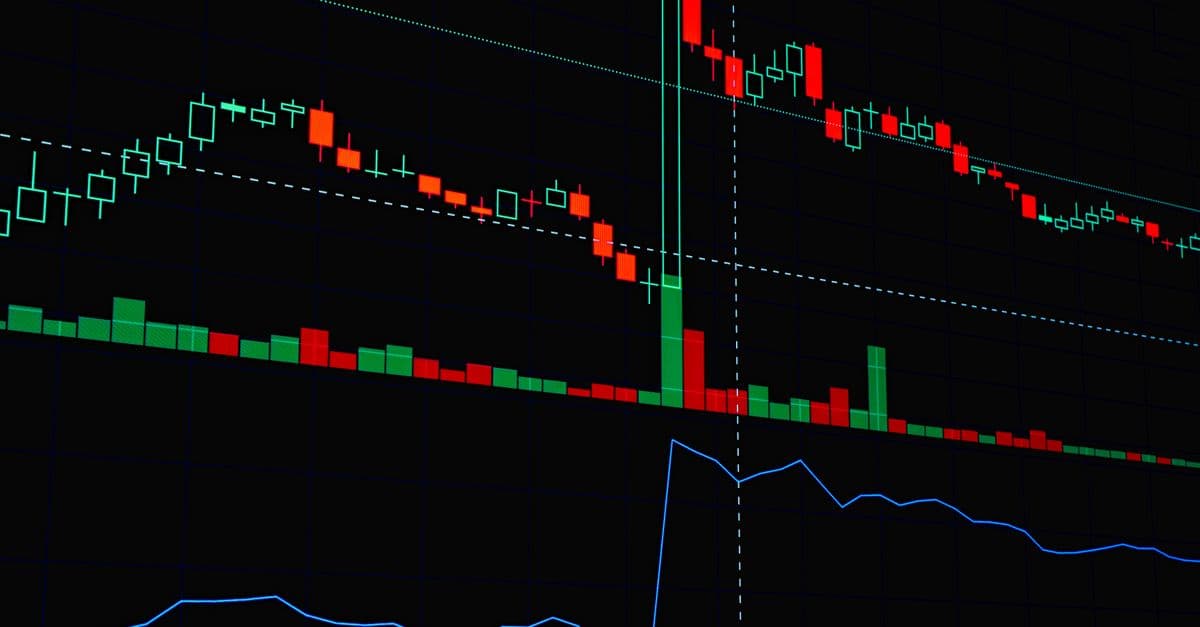
Stock Market Pattern Analyzer
Spot High-Probability Chart Patterns Before They Move
What You Can Do
Transform raw price data into actionable trading signals by systematically identifying technical chart patterns with quantified win rates and precise entry/exit levels. Stop guessing which setups are worth trading. Get a probability score and risk/reward ratio for every pattern Claude finds, letting you focus capital only on high-conviction setups that match your edge.
Features
Automatically identify head-and-shoulders, triangles, flags, wedges, double tops/bottoms, MACD divergences, and other key technical patterns from price data
Each pattern receives a quantified win rate based on historical performance, showing you exactly how often similar setups have been profitable
Get exact price levels for entry, stop-loss, and take-profit based on support/resistance and pattern geometry, not guesswork
Know your expected risk versus potential gain before entering any trade, helping you filter for setups meeting your minimum 1:2 or 1:3 ratio
Eliminate low-confidence patterns using confirmation signals like volume confirmation, moving average alignment, and trend consistency
See how your current chart setup compares to similar past patterns, including win rates and average profit/loss outcomes
Scan 10, 50, or 100+ stocks at once to find all tradeable patterns, saving hours of manual chart scanning
Step-by-step confirmation framework to validate that a pattern is real before committing capital
Example Output
Example 1: Single Pattern Analysis
Ticker: NVDA | Pattern: Head and Shoulders Reversal
Confidence: 78% | Historical Win Rate: 76% (based on 34 similar patterns)
Entry Level: $142.50 | Stop Loss: $138.20 | Target: $135.00
Risk/Reward Ratio: 1 : 2.3 | Max Risk: $430 per 100 shares
Confirmation Signals: Volume declining into neckline ✓, RSI divergence present ✓
Status: READY TO TRADE
Example 2: Batch Scan Results
Scanned 25 tech stocks | Found 7 high-probability setups

1. TSLA - Ascending Triangle | 81% confidence | 1:2.8 R/R
2. AMD - Double Bottom | 72% confidence | 1:2.1 R/R
3. META - Breakout Setup | 68% confidence | 1:1.9 R/R
4. INTC - Rising Wedge (Reversal) | 75% confidence | 1:3.2 R/R
5. QCOM - MACD Divergence | 70% confidence | 1:2.0 R/R
...
Example 3: Historical Comparison
Current Setup: Inverse Head and Shoulders on SPY 15-min chart
Matched to 18 similar historical patterns:
- 14 patterns won (77.8% win rate)
- 4 patterns lost (22.2% loss rate)
- Average profit on winners: $340
- Average loss on losers: $215
- Median R/R ratio achieved: 1 : 2.1
What's Included
- Pattern Recognition Engine: Core system to detect and classify 15+ technical chart patterns from OHLC price data
- Probability Scorecard: Quantified win rates, historical performance metrics, and statistical confidence intervals for each pattern type
- Entry/Exit Calculator: Automated placement of entry points, stop-loss, and take-profit levels based on pattern geometry and support/resistance
- Batch Analysis Tool: Process 50+ stocks in a single request and receive a prioritized list of tradeable patterns ranked by probability
- Trade Setup Verification Checklist: Step-by-step confirmation framework covering volume, trend direction, moving averages, and divergence signals
- Trade Journal Template: Structured format to log trades, outcomes, and learnings so you can refine your pattern selection over time
Who It's For
- Active/Swing Traders
- Day Traders Seeking High-Probability Setups
- Technical Analysts Wanting to Systematize Pattern Recognition
- Portfolio Managers Screening for Technical Opportunities
- Retail Traders Removing Emotional Bias from Decisions
Best For
- Identifying high-probability chart pattern entry points
- Validating technical setups with quantified statistics
- Scanning 50+ stocks for tradeable patterns at once
- Calculating precise risk/reward ratios before entering trades
- Removing guesswork and emotional bias from chart analysis
You might also like

Coordinate pricing, service menus, and product offerings across all locations while accommodating local market variations. Synchronize inventory levels to prevent stockouts at high-performing sites and overstock at slower locations. Generate cross-location staff scheduling recommendations that balance labor costs with service demand. Identify underperforming services or locations through comparative analytics and receive data-driven optimization recommendations.
 by atopile
You can analyze historical sales data to identify seasonal trends and slow-moving SKUs, calculate optimal reorder quantities based on shelf space and turnover targets, evaluate vendor reliability and negotiate volume discounts, and model the profit impact of assortment changes. This skill transforms purchasing from guesswork into a systematic, data-backed process that balances margin requirements with inventory turnover.
by atopile
Systematically identify chart patterns and validate them using technical confluence scoring. You get actionable trade setups with entry/exit levels and risk/reward analysis based on multiple indicator confirmation. Filter false signals and improve your trade quality by combining technical indicators in a disciplined framework.
 by eternaljust
You can input your current salon schedule, staff roster, service menu, and utilization data to identify revenue gaps and inefficiencies. Claude analyzes staggered service durations, chair dependencies, and staff skill matching to recommend optimized schedules that increase per-chair revenue while reducing client wait times and staff idle time. You'll receive actionable scheduling adjustments tailored to your salon's specific services and constraints.
by atopileYou can systematically analyze stock chart patterns to identify potential trading setups and validate technical formations. The skill examines price action, support/resistance levels, and trend formations to help you recognize bullish and bearish signals with structured analysis and clear confidence assessment. This enables more informed trading decisions backed by technical pattern recognition.
by eternaljust
You can analyze beauty trend signals across multiple independent data sources—social media, retail analytics, ingredient innovations, and demographic shifts—to distinguish between micro-trends (3-6 month lifecycle) and macro-trends (24+ month runway). The skill helps you quantify trend velocity, identify category expansion opportunities, time market entry windows before trends peak, and assess saturation levels to guide purchasing decisions and inventory investment with confidence.
by atopile
You'll create personalized salary negotiation scripts that combine market research, role-specific strategies, and objection-handling techniques. The skill generates dialogue examples, counter-arguments backed by industry data, and psychological frameworks to confidently approach salary conversations. Each script is tailored to your position, experience level, and target compensation range.
by atopile
You'll transform product information into educator-ready curricula that teach beauty professionals foundational chemistry, advanced consultation techniques, objection handling, and client-facing talking points. The skill generates modular training programs tailored to different learning styles and experience levels, enabling you to onboard teams confidently, launch new products rapidly, and build certification-track programs that maintain scientific accuracy and brand alignment.
by atopile