


NVH Diagnostic Analysis & Root Cause Identification
Diagnose NVH issues using acoustic data and modal analysis frameworks

What You Can Do
You can transform raw accelerometer data, sound pressure measurements, and frequency spectra into structured diagnostic insights. Claude helps you organize test data, interpret Campbell diagrams and waterfall plots, quantify source contributions through transfer path analysis, and correlate physical measurements with customer complaints. This systematic approach replaces intuitive troubleshooting with hypothesis-driven test plans and targeted solutions.
Features
Analyze FFT data and frequency domains to identify dominant noise sources and resonance peaks
Quantify how much each source (powertrain, chassis, tire, wind) contributes to overall vehicle NVH
Cross-reference Campbell diagrams, waterfall plots, and durational test data to track resonances across operating ranges
Systematically break down NVH phenomena into sources, transmission paths, and receiver response for targeted fixes
Design and evaluate ride-by, stationary, dyno, and coast-down NVH test protocols with documented acceptance criteria
Generate ranked diagnostic hypotheses based on frequency content, vehicle architecture, and powertrain configuration
Quantify NVH impact of design changes (damping, stiffness, isolation) using before/after spectral analysis
Link subjective feedback to objective measurement data for prioritized engineering response
Example Output
Example 1: High-frequency wind noise at highway speeds Input: Sound pressure level data (80–16 kHz), vehicle speed sweep, A-weighted spectrum showing 2–4 kHz dominance
Output:
- Primary source: A-pillar air flow separation (A-weighted peak at 2.8 kHz matches known cavity resonance)
- Secondary contribution: Window seal leakage (broadband 4–8 kHz elevation)
- Recommended actions: (1) A-pillar fairing geometry review, (2) window seal stiffness increase, (3) validation via transfer path weighting
- Next test: Stationary wind tunnel with microphone array to confirm spatial source locations
Example 2: Engine-order vibration during acceleration Input: Accelerometer data (engine block, firewall, cabin floor), Campbell diagram, 0–6000 RPM sweep
Output:
- Modal match identified: 2nd engine order (2× crankshaft frequency) excites firewall bending mode at 280 Hz near 4200 RPM
- Path dominance: Firewall coupling accounts for 60% of cabin vibration (TPA result); motor mounts account for 35%
- Root cause: Firewall natural frequency too close to engine excitation
- Intervention options: (1) increase firewall thickness, (2) add localized damping, (3) motor mount stiffness adjustment
- Validation plan: Dyno test with modified motor mounts; measure firewall acceleration before/after
What's Included
- SKILL.md instruction file with NVH diagnostic framework and decision trees:
- Spectral analysis checklist: frequencies to inspect, peak identification, frequency weighting standards (A, C, Z)
- Transfer Path Analysis (TPA) template: source identification table, path quantification worksheet, receiver weighting matrix
- Test planning framework: ride-by, stationary, dyno, and coast-down test specifications with acceptance criteria
- Root cause hypothesis matrix: common NVH failure modes by vehicle subsystem (powertrain, chassis, aerodynamic, tire)
- Campbell diagram interpretation guide: order tracking, resonance crossing identification, modal assignment checklist
Who It's For
- NVH Engineers — conduct systematic acoustic and vibration diagnosis with confidence and repeatability
- Vehicle Integration Engineers — correlate subsystem design changes to whole-vehicle NVH performance
- Powertrain Engineers — diagnose engine and transmission noise contributions and validate isolation solutions
- Chassis Engineers — identify suspension and structural resonances affecting ride quality and harshness
- Quality and Warranty Engineers — prioritize customer NVH complaints using objective measurement data and root cause analysis
Best For
- Frequency spectrum analysis — interpreting accelerometer and sound pressure level data across operating ranges
- Transfer path quantification — decomposing total vehicle NVH into source contributions for targeted engineering action
- Modal resonance investigation — correlating physical modes with measured peaks and planning stiffness or damping changes
- Test plan development — designing NVH measurement procedures (dyno, road, wind tunnel) with documented protocols and acceptance limits
- Baseline-to-modification comparison — quantifying NVH impact of design iterations using before/after spectral analysis
You might also like
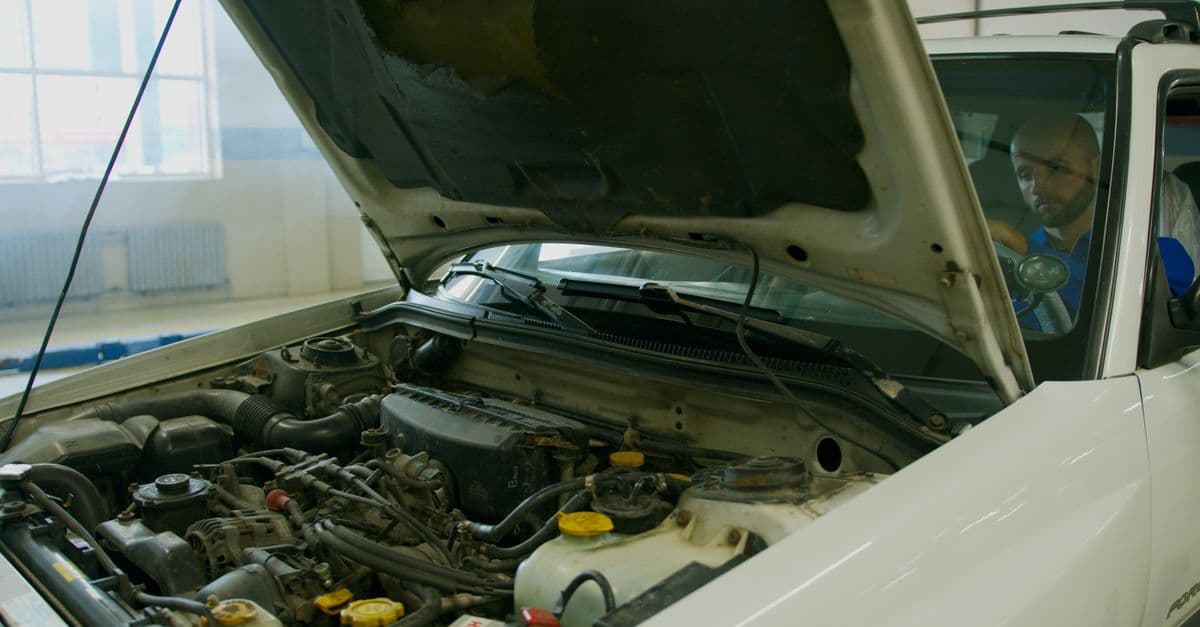
You can pinpoint the exact source of sensor fusion failures—whether they stem from misaligned camera/LiDAR/radar extrinsic calibration, timestamp desynchronization, data validation gaps, or algorithmic issues. This skill decomposes multi-modal perception errors into sensor-specific contributions and generates quantifiable diagnostic reports that directly guide calibration and testing teams toward fixes rather than blind troubleshooting.
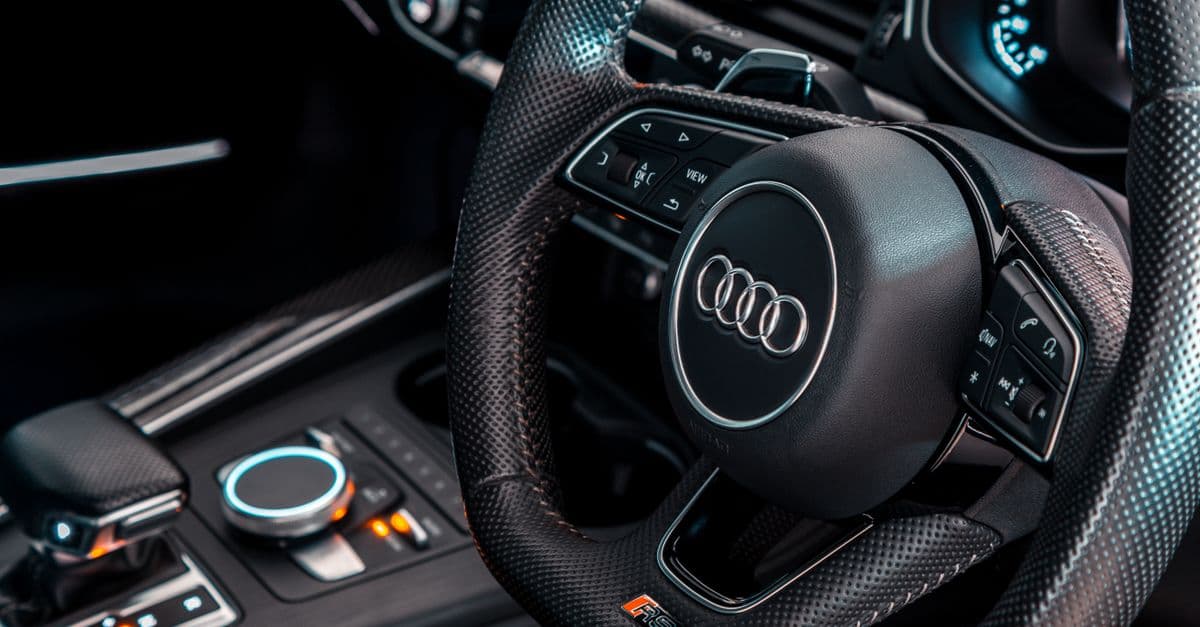
You can analyze multi-dimensional steering system performance including torque characteristics, self-alignment torque, steering angle feedback, road feel transmission, and torque vectoring effects. Extract actionable insights from simulation and test data to identify root causes of steering feel issues, then develop tuning recommendations for steering gear ratios, EPS algorithms, suspension geometry effects, and torque vectoring control strategies.

This skill helps you architect platform strategy by generating decision frameworks, prioritization matrices, and roadmap plans that account for developer ecosystem impact. You'll analyze tradeoffs between breaking changes, feature velocity, and technical debt to make confident platform decisions. It synthesizes developer feedback, competitive positioning, and business goals into actionable strategic outputs that your team can execute.

You can design complete AUTOSAR 4.x system architectures by automating component allocation across abstraction layers, modeling port interactions and service interfaces, and validating compliance with AUTOSAR standards. Claude helps you create standardized architecture documentation, detect circular dependencies and interface mismatches, and generate port interaction matrices—accelerating ECU architecture development while ensuring standards adherence.

You can analyze FEA thermal simulation data to identify motor hotspots, calculate heat generation from motor losses across operating points, evaluate competing cooling solutions quantitatively, and troubleshoot excessive temperature rise during dyno testing. The skill helps you validate thermal management design margins, assess motor lifetime degradation risk, and optimize cooling loop efficiency—enabling data-driven thermal design decisions before building prototypes.
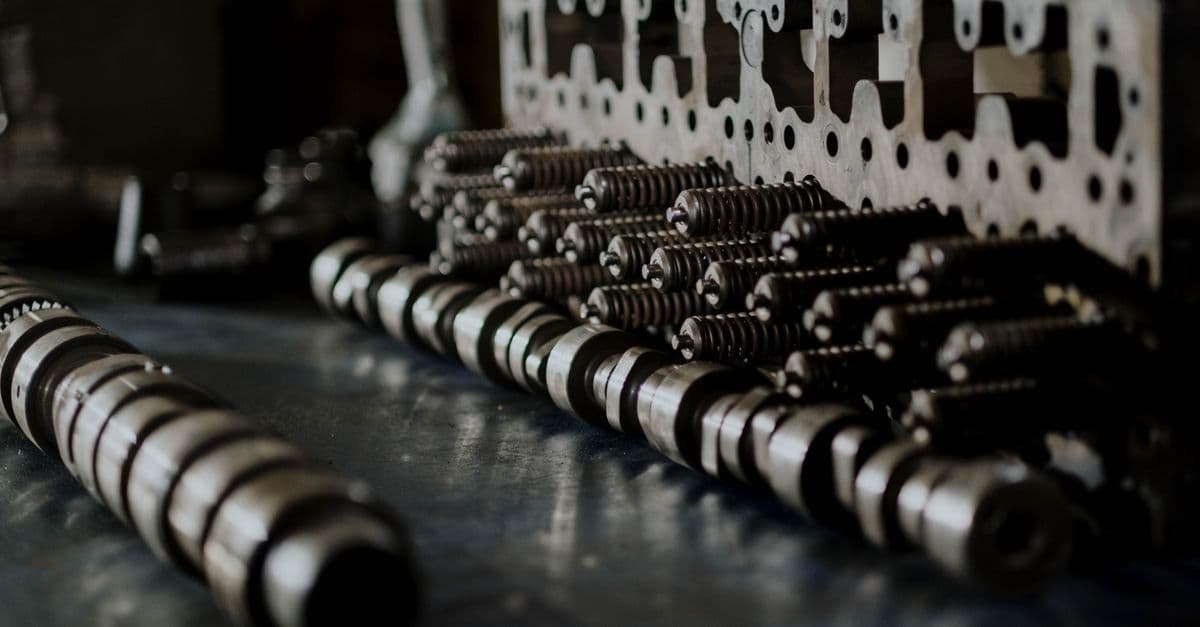
You can efficiently diagnose complex NVH concerns by working through a structured framework that correlates customer symptoms with potential powertrain failures. This skill helps you narrow diagnostic possibilities, recommend targeted testing sequences, distinguish between component failures and tuning issues, and substantiate warranty claims with technical evidence.
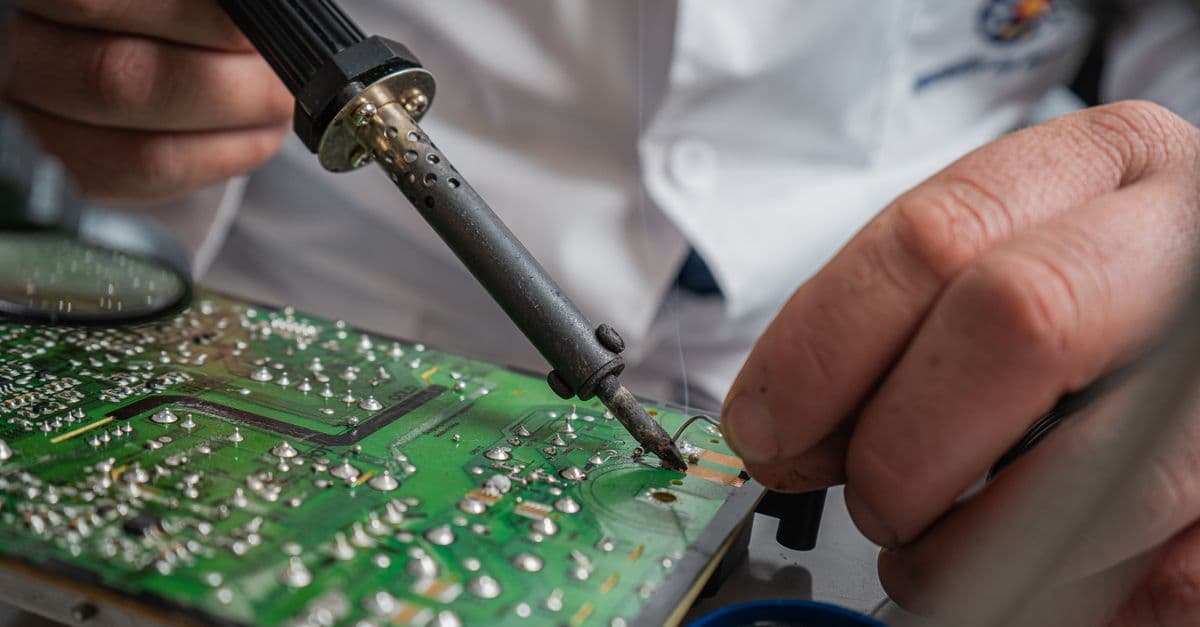
You can model transient and steady-state thermal behavior in EV power electronics, calculate junction temperature rise during driving cycles, and design cooling strategies that meet automotive thermal specifications. This skill helps you size heat sinks, evaluate thermal interface materials, compare active versus passive cooling approaches, and validate designs against AEC-Q200 and ISO 16750-3 standards.

You can quantify sensor fusion performance across object detection, classification, tracking, and localization using standardized metrics. The framework helps you identify systematic failure modes in diverse environmental conditions, document safety-critical gaps, and generate structured evidence packages for ISO 26262 and SOTIF compliance. This enables you to benchmark sensor configurations, define perception KPIs, and support regulatory submissions with rigorous performance documentation.