


Logistics Cost Optimization & Carrier Performance Analysis
Optimize shipping costs and evaluate carrier performance instantly

What You Can Do
Analyze your logistics spending across carriers, benchmark performance metrics, and identify concrete cost-saving opportunities. This skill processes shipping data, service levels, and contract terms to reveal redundancies, negotiate better rates, and optimize your carrier mix. Get actionable insights on where to consolidate shipments, switch providers, or renegotiate contracts based on performance gaps.
Features
Compare your rates against industry standards and your own carrier portfolio to identify overpaying opportunities
Correlate on-time delivery, damage rates, and service levels with carrier costs to find underperforming providers
Dissect spending by origin-destination pair to spot expensive routes and consolidation opportunities
Extract negotiation insights from current contracts and recommend terms based on volume, service levels, and market data
Model the financial impact of reducing carrier count, shifting volume to tier-1 providers, and eliminating redundancy
Track spending and performance trends month-over-month to project savings and identify seasonal patterns
Generate data-backed arguments for rate reduction, service credits, and favorable contract amendments
Example Output
Carrier Cost Analysis Summary
• FedEx Ground: $487K annual spend (34% of total) | On-time: 94% | Damage rate: 2.1% | Action: Rates 8% above market average — negotiate volume discount or migrate 20% volume to UPS Ground
• UPS Ground: $298K (21%) | On-time: 98% | Damage rate: 0.8% | Action: Tier-1 performer — consolidate additional volume here to reach $400K threshold (estimated 3% rate reduction)
• XPO Logistics: $156K (11%) | On-time: 87% | Damage rate: 3.4% | Action: Below-standard performance — $18K annual cost to handle damage claims. Recommend migration to FedEx with service guarantees.
Savings Opportunity: Consolidate FedEx/UPS/XPO into top-2 carriers → estimated $63K-85K annual savings (9-12% reduction) with 2% service improvement.
What's Included
- Carrier Performance Scorecard: Track on-time delivery, damage rates, invoice accuracy, and customer complaint rates for each carrier with historical trends
- Cost Analysis Dashboard Template: Monthly spend by carrier, lane, service type, and seasonality with variance analysis vs. budget
- Contract Negotiation Framework: Pricing tiers by shipment volume, service levels, and lanes; talking points for rate reduction and term improvements
- Consolidation Scenario Models: Financial impact calculator for reducing carrier count, volume reallocation, and renegotiation outcomes
- Lane Optimization Checklist: Identify consolidation opportunities, service gaps, and carrier switches by origin-destination pair
Who It's For
- Logistics Managers
- Supply Chain Directors
- Procurement Specialists
- Finance & Operations Teams
Best For
- Reducing shipping costs and overhead
- Evaluating and renegotiating carrier contracts
- Consolidating carrier portfolios
- Benchmarking performance against industry standards
- Identifying service gaps and quality issues
You might also like

This skill systematically evaluates RFQ responses across multiple dimensions—price, quality, delivery, capability, and risk—to generate scoring matrices, risk assessments, and supplier rankings. You'll make data-driven sourcing decisions with transparent methodology and reduce vendor bias through weighted evaluation criteria aligned to your procurement priorities.
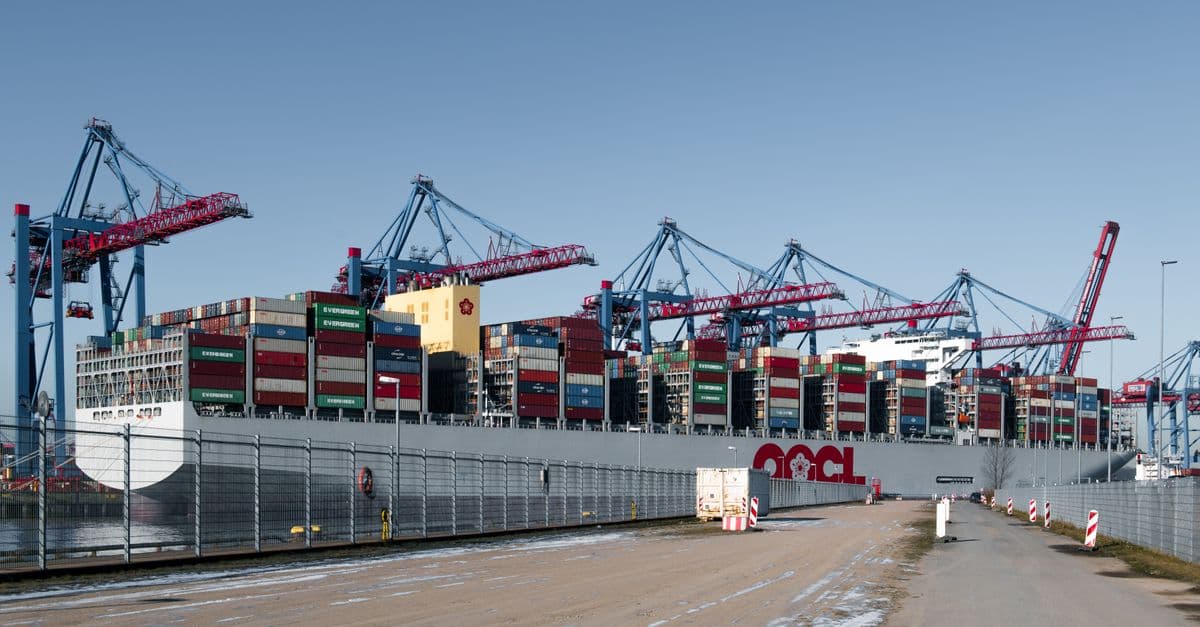
You can analyze shipping expenses across multiple carriers, identify cost-saving opportunities, and evaluate carrier performance metrics to reduce logistics expenses. The skill compares rates, delivery times, reliability scores, and service quality to help you negotiate better contracts and make data-driven carrier selection decisions.
Analyze supplier capabilities and proposals using structured evaluation frameworks that score vendors across cost, quality, delivery, and risk dimensions. Claude builds comprehensive negotiation strategies with quantified leverage points, walkaway prices, and contract optimization recommendations. You'll reduce material costs by 10-20% while minimizing supply chain risks through data-driven decision-making.

You provide historical sales data, supplier lead times, and market context—Claude analyzes patterns, detects seasonality, and generates demand forecasts with confidence intervals. You get actionable inventory recommendations, scenario projections, and early warnings for demand anomalies to optimize stock levels and reduce waste.

You'll create comprehensive, data-driven vendor negotiation briefs that synthesize vendor background, pricing history, market position, and negotiation leverage into a concise, actionable brief. The skill analyzes your vendor context and generates talking points, risk assessments, and strategic recommendations tailored to your negotiation objectives.

You analyze your historical sales data, demand patterns, and inventory metrics to identify optimal stock levels, reorder points, and safety stock quantities. The skill integrates with your ERP system's data to reduce excess inventory, prevent stockouts, and provide cost-benefit analysis for inventory decisions. You get actionable recommendations on ABC analysis, seasonal adjustments, and inventory turnover optimization.

This skill quickly analyzes inventory discrepancies from cycle counts, pinpoints the likely root causes, and recommends specific corrective actions to improve accuracy. You can upload count data, review detailed variance breakdowns by location or SKU, and get actionable insights to close gaps in your inventory management.

This skill guides you through structured demand forecasting and launch planning when you have limited historical data for a new product. It builds multiple demand scenarios using comparable products, market signals, and validated growth curves, then creates cross-functional alignment frameworks to stress-test your assumptions and reduce launch risk.