


Inside Sales Metrics Optimizer
Diagnose Sales Bottlenecks & Forecast Revenue Growth
What You Can Do
Analyze your sales pipeline, revenue data, and team performance metrics to identify bottlenecks and opportunities. You'll receive data-driven insights on conversion rates, sales velocity, and forecast accuracy, plus actionable recommendations to optimize your sales process and accelerate revenue growth.
Features
Identify where deals are stalling in your sales pipeline using stage transition data and cycle time analysis
Generate probabilistic revenue forecasts based on pipeline data, historical win rates, and deal velocity
Benchmark individual and team performance against quotas, win rates, and average deal size
Analyze conversion rates at each pipeline stage and recommend improvements to move deals forward
Calculate time spent in each stage and identify where deals are moving quickly versus getting stuck
Compare win rates by product, customer segment, and sales rep to pinpoint high-performing strategies
Monitor progress toward quotas with trend analysis and early warning signals for underperformance
Identify seasonal patterns and forecast how trends will affect future revenue across quarters
Example Output
Pipeline Analysis Example:
Stage Performance Report
- Discovery: 45 deals | Avg cycle 8 days | 25% conversion
- Proposal: 28 deals | Avg cycle 14 days | 60% conversion ⚠️ BOTTLENECK
- Negotiation: 12 deals | Avg cycle 10 days | 85% conversion
- Closed Won: 10 deals | Avg deal size $45K

Recommendation: Proposal stage is 40% slower than benchmark.
Increase demo capacity to accelerate buyer alignment.
Revenue Forecast Example:
Q4 Revenue Forecast: $2.3M (p50 most likely)
Confidence Range: $1.8M - $2.8M (p10-p90)
Current pipeline risk: $200K short of quota
Action: Focus resources on early-stage pipeline expansion
Performance Snapshot: Top performer: Sarah Chen | 72% win rate | 18-day cycle | $410K YTD Rep needing coaching: Marcus L. | 38% win rate | 28-day cycle | $185K YTD
What's Included
- Pipeline Diagnostic Framework: Structured methodology to identify bottlenecks, conversion barriers, and specific optimization opportunities
- Revenue Forecasting Model: Probabilistic forecasting using pipeline data weighted by deal probability and historical close rates
- Performance Benchmarking Tool: Compare your metrics against industry standards and internal baselines to set realistic improvement targets
- Optimization Recommendations: Prioritized, actionable suggestions to improve conversion rates, reduce cycle time, and accelerate revenue
- Data Interpretation Guide: Clear explanations of key metrics—cycle time, win rate, velocity, SAC, LTV—and what they mean for your business
- Custom Dashboard Templates: Pre-built tracking templates for monitoring metrics over time and measuring improvement initiative success
Who It's For
- Sales Directors & VPs of Sales
- Sales Operations Managers
- Revenue Leaders & Chief Revenue Officers
- Business Intelligence Analysts
- Sales Coaching & Development Managers
Best For
- Diagnosing why deals stall or take longer than expected to close
- Forecasting quarterly or annual revenue with confidence intervals
- Identifying top performers and underperforming team members
- Optimizing sales process and reducing overall cycle time
- Benchmarking performance and setting realistic improvement targets
You might also like

Upload your sales pipeline data and Claude analyzes deal health, bottlenecks, and win probability in seconds. You'll receive specific coaching for each deal—what's working, what's stuck, and exactly what to do next. Get data-driven forecasts and spot hidden opportunities in your pipeline.
 by noxels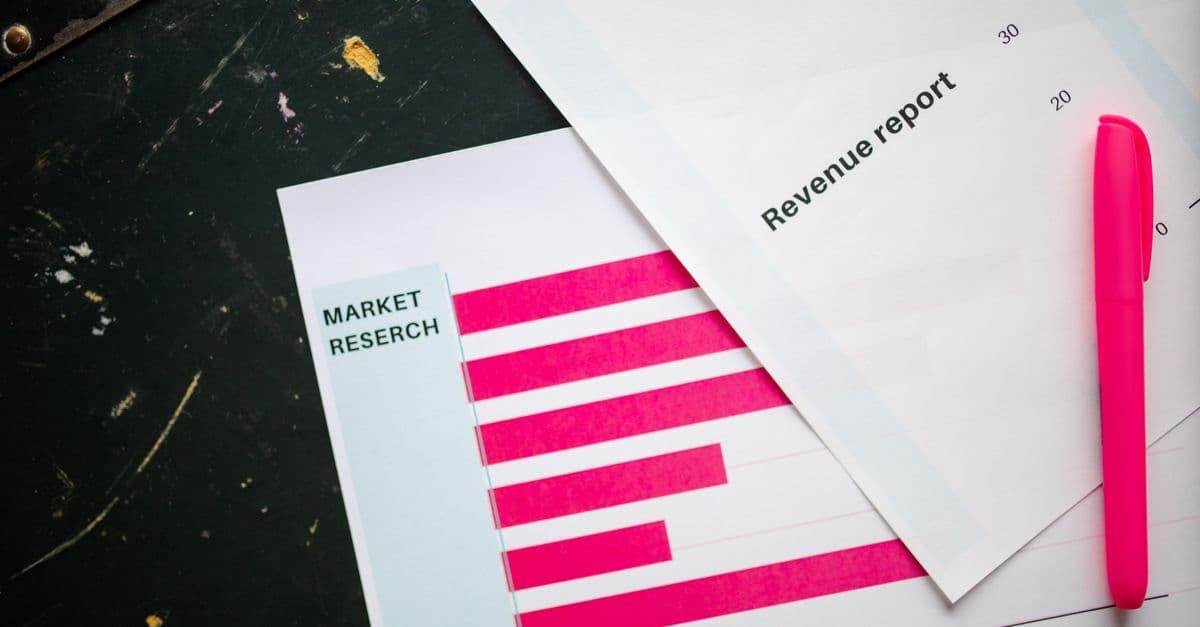
You get a comprehensive analysis of your sales pipeline's health, identifying bottlenecks and conversion inefficiencies. The skill segments your accounts by revenue potential and risk, then generates statistically sound revenue forecasts with confidence intervals. You'll receive actionable recommendations to accelerate deals, optimize your sales motion, and align your team's efforts to quota.
by noxels
You can rapidly create customized demo scripts, POC scope documents, and value narratives for any prospect in minutes. This skill analyzes prospect persona, industry, and pain points to generate persuasive sales collateral that accelerates deals from lead to POC to close. You'll win more demos, convert more to POCs, and shorten sales cycles with personalized, objection-ready materials.
by noxels
Generate comprehensive technical integration specifications, system architecture diagrams, implementation roadmaps, and risk assessments that demonstrate feasibility to stakeholders and win complex enterprise deals. You'll produce professional deliverables that translate business requirements into detailed technical plans, complete with timeline estimates, resource allocation, and risk mitigation strategies.
by noxels
Conduct structured technical discovery interviews to uncover customer needs, architect custom multi-tier solutions tailored to their environment, and validate feasibility before presenting proposals. Claude guides you through questioning frameworks, generates solution designs with integration maps, identifies technical risks, and produces proposal-ready documentation—turning discovery insights into revenue-winning sales conversations.
by noxels
Conduct structured technical requirement discovery by answering guided discovery questions about customer needs, infrastructure, constraints, and use cases. Claude analyzes your inputs for feasibility, identifies gaps and risks, and generates a professional SOW-ready scope document that's stakeholder-ready and contract-approved. This compresses weeks of scoping work into hours.
by noxels
You can develop data-driven market entry strategies by analyzing market size, growth rates, competitive dynamics, and regulatory environments. The skill identifies region-specific risks and opportunities, assesses customer segments and localization needs, and forecasts commercial viability to help you make informed expansion decisions.
by noxels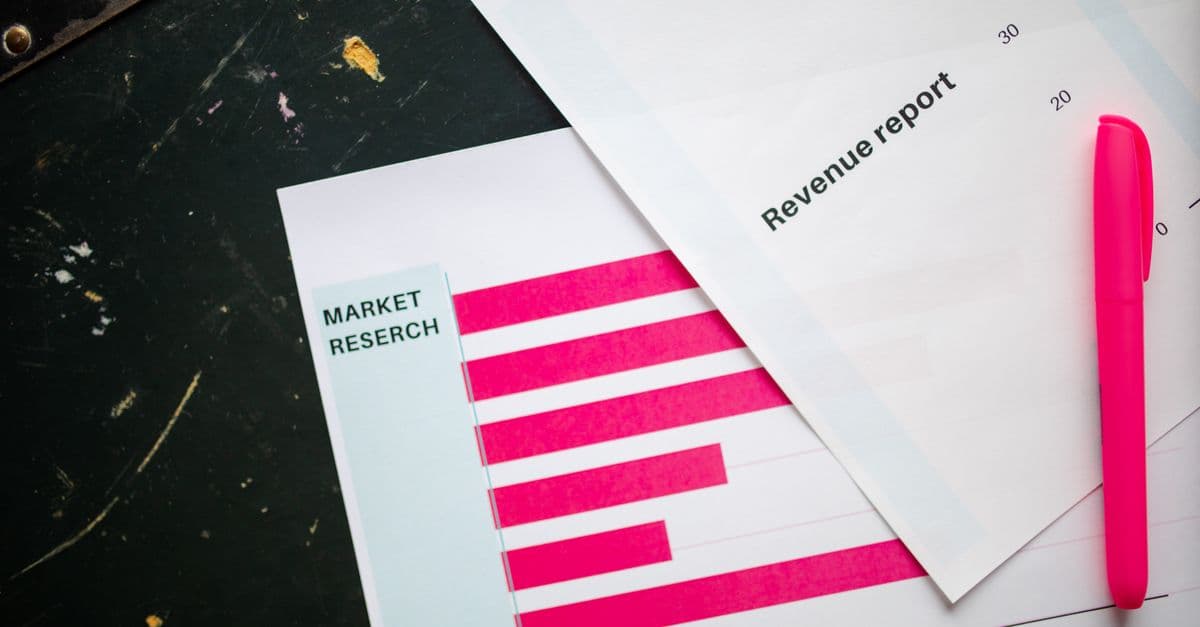
You'll create highly targeted multi-touch prospecting sequences designed specifically for SMB decision-makers. The skill generates research-backed positioning, identifies buying committee members, and delivers SMB-specific objection rebuttals. Each sequence balances personalization with scalability, using dynamic templates that adapt to company size, industry, and growth stage — delivering higher response rates and faster qualification cycles.
by noxels