


Demand Forecast Analyst
Generate demand forecasts with documented assumptions and scenario analysis

What You Can Do
You can analyze historical demand patterns, generate statistical forecasts with explicit assumptions, and create best/base/worst-case scenarios for supply chain planning. The skill evaluates demand seasonality, trends, and volatility to produce actionable forecasts with confidence intervals. Your results include documented methodology, key assumptions, and specific recommendations for inventory and production planning.
Features
Automatically detect and quantify trends, seasonality, and cyclical patterns in your historical demand data
Generate forecasts using multiple statistical approaches (exponential smoothing, trend regression, seasonal decomposition) and compare accuracy
Transparently list all assumptions, methodology choices, and data limitations so stakeholders understand forecast foundations
Create best-case, base-case, and worst-case demand scenarios with probability weights for strategic planning
Quantify forecast uncertainty with statistical confidence bands at 80%, 90%, and 95% levels to inform safety stock decisions
Translate forecasts into specific inventory, production ramp, and procurement lead-time recommendations
Account for holiday peaks, seasonal fluctuations, and calendar effects to improve forecast accuracy
Example Output
Demand Forecast Summary (6-Month Outlook)
Historical Analysis
- Average monthly demand: 15,400 units
- Trend: +3.2% YoY growth
- Seasonality: Peak in Q4 (+28%), trough in Q1 (-18%)
- Volatility: 2,100 units (std dev)
Base-Case Forecast
| Month | Forecast | 80% CI | 90% CI | Notes |
|---|---|---|---|---|
| Sep | 16,800 | ±2,600 | ±3,100 | Summer decline ending |
| Oct | 18,900 | ±2,800 | ±3,400 | Pre-holiday ramp |
| Nov | 22,400 | ±3,200 | ±3,900 | Peak season |
| Dec | 21,600 | ±3,100 | ±3,800 | Holiday sustained |
Scenario Comparison
- Worst-Case (20%): 12% demand reduction → 14,700 avg units/month
- Base-Case (60%): Current trends → 16,900 avg units/month
- Best-Case (20%): 8% surge from new customers → 18,200 avg units/month
Key Assumptions ✓ Historical patterns remain stable ✓ No major product line changes ✓ Current macroeconomic conditions persist ✓ Seasonal factors consistent with past 24 months
What's Included
- Demand Pattern Analysis Report: Quantified trends, seasonality factors, and volatility metrics from your historical data
- 6-Month Forecast with Confidence Intervals: Point forecasts and statistical uncertainty bands at 80%, 90%, and 95% confidence levels
- Scenario Analysis Framework: Best/base/worst-case scenarios with explicit probability weights and business driver assumptions
- Documented Methodology: Complete transparency on forecasting methods, data quality issues, and key assumptions
- Supply Chain Recommendations: Specific guidance on safety stock levels, production ramps, and supplier lead time planning
- Assumption Sensitivity Analysis: Quantified impact of changing key assumptions on forecast outcomes
Who It's For
- Supply Chain Managers
- Demand Planners
- Manufacturing Operations Managers
- Production Schedulers
- Business Analysts
Best For
- Monthly and quarterly demand forecasting
- Scenario planning for capacity and inventory decisions
- Evaluating forecast uncertainty and risk
- Documenting assumptions for stakeholder alignment
- Seasonal demand adjustment and peak planning
You might also like

You can map your entire supply chain network, identify bottlenecks and inefficiencies, and model optimization scenarios. This skill helps you visualize supplier relationships, distribution channels, and logistics flows to find cost savings and reduce delivery times. You'll get actionable recommendations backed by network analysis and scenario modeling.

You'll create comprehensive, data-driven vendor negotiation briefs that synthesize vendor background, pricing history, market position, and negotiation leverage into a concise, actionable brief. The skill analyzes your vendor context and generates talking points, risk assessments, and strategic recommendations tailored to your negotiation objectives.

You can feed support ticket data, interaction logs, and customer engagement metrics into Claude, which automatically surfaces churn risk signals—declining engagement patterns, sentiment shifts toward frustration, feature adoption gaps, and escalation trajectories. Claude generates risk scores (Critical/High/Medium/Low) with specific evidence and recommends targeted interventions before customers reach the cancellation stage.

This skill quickly analyzes inventory discrepancies from cycle counts, pinpoints the likely root causes, and recommends specific corrective actions to improve accuracy. You can upload count data, review detailed variance breakdowns by location or SKU, and get actionable insights to close gaps in your inventory management.

This skill analyzes complex supply chain networks to identify optimization opportunities across cost, service levels, and environmental impact. You can model network changes, evaluate supplier alternatives, and forecast the impact of disruptions before implementation. It provides data-driven recommendations for network redesign, inventory rebalancing, carrier selection, and sustainability improvements.
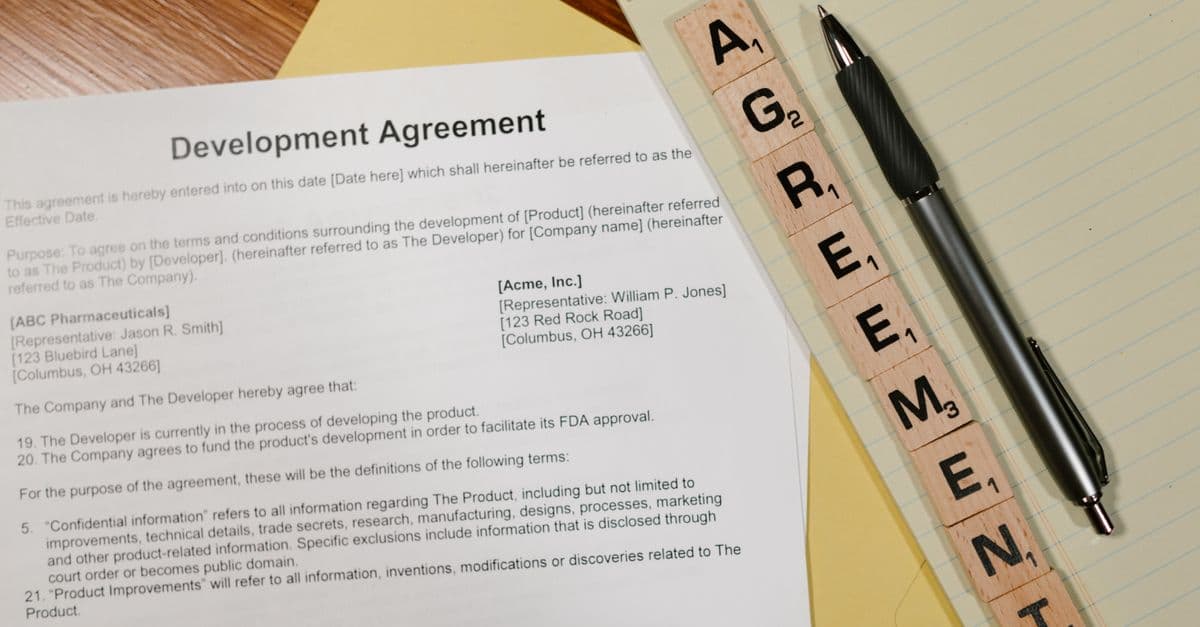
Analyze supplier capabilities and proposals using structured evaluation frameworks that score vendors across cost, quality, delivery, and risk dimensions. Claude builds comprehensive negotiation strategies with quantified leverage points, walkaway prices, and contract optimization recommendations. You'll reduce material costs by 10-20% while minimizing supply chain risks through data-driven decision-making.

This skill transforms how you review and negotiate contracts by automatically identifying risks, spotting unfavorable clauses, and generating data-backed negotiation strategies. You get detailed risk scoring, compliance checks, and financial impact analysis—turning hours of manual review into minutes of actionable insights. It helps you close contracts faster while protecting your organization from costly mistakes.

You can analyze shipping expenses across multiple carriers, identify cost-saving opportunities, and evaluate carrier performance metrics to reduce logistics expenses. The skill compares rates, delivery times, reliability scores, and service quality to help you negotiate better contracts and make data-driven carrier selection decisions.