

EM Survey Interpreter for Mining Exploration
Interpret EM survey data and structure exploration reports
What You Can Do
Analyze electromagnetic survey datasets to identify mineral prospects and anomalies, design optimized EM survey layouts for exploration campaigns, and structure comprehensive geophysical findings into professional mining reports. You can process raw survey data, interpret conductivity patterns, estimate target depths, and generate prioritized drilling recommendations.
Features
Analyze raw electromagnetic survey datasets to identify anomalies, conductivity patterns, and EM signatures indicative of mineralization targets
Design efficient EM survey layouts with proper line spacing, sensor orientation, and sampling strategy based on target depth and project geology
Categorize EM anomalies by type and assess their geological significance for exploration targeting and drilling prioritization
Calculate apparent depths to anomalies using standard EM response modeling and phase shift analysis techniques
Cross-reference EM data with magnetic, gravity, and geological context to refine interpretations and reduce false positives
Organize geophysical findings into professional exploration reports following industry standards and regulatory requirements
Generate ranked drilling targets with confidence assessments and predicted mineralization characteristics based on EM response patterns
Example Output
Input: Raw EM survey profile with 52 stations, conductivity readings, and phase shift data across a 2.5km line over a known mineral belt
Output:
EM Survey Interpretation Summary
Anomaly Findings
| Anomaly | Location | Conductivity | Est. Depth | Type | Confidence |
|---|---|---|---|---|---|
| A | Stn 18-22 | High (>1000 mS/m) | 120-160m | Massive conductor | High |
| B | Stn 35-38 | Moderate (400-600) | 200-250m | Disseminated | Medium |
| C | Stn 44-48 | Weak (100-150) | 280m+ | Deep target | Low |
Drilling Recommendations
- Priority 1: Target A1 at Stn 20 — drill to 200m (massive sulfide signature)
- Priority 2: Target A2 at Stn 24 — drill to 180m (strong response edge)
- Priority 3: Target B1 at Stn 36 — drill to 300m (follow-up)
QA Status
- ✓ Noise levels <5% of signal
- ✓ Phase consistency within ±2°
- ✓ Coupling effects minimal
- ✓ Data suitable for drilling planning
What's Included
- EM Interpretation Framework: Decision trees and templates for classifying anomalies, assessing response strength, and evaluating geological context
- Survey Design Checklist: Guidance for line spacing calculations, station density optimization, and equipment configuration based on exploration objectives
- Professional Report Template: Complete structure with methodology section, anomaly tables, depth estimates, and drilling recommendations ready for client delivery
- Depth Estimation Methods: Standard EM modeling techniques and response curve interpretation formulas for calculating target depths
- Data Quality Protocol: Validation checklist for noise assessment, phase shift verification, and coupling effect evaluation
Who It's For
- Exploration Geophysicists
- Mining Exploration Engineers
- Resource Project Managers
- Mining Consultants
Best For
- Early-stage EM data screening and anomaly assessment
- Survey planning and design optimization
- Professional exploration report generation
- Drilling target prioritization and selection
You might also like

You can analyze gravity and magnetic field data to identify subsurface mineral deposits, develop 3D geological models, and prioritize drill targets with confidence assessments. This skill processes raw geophysical measurements, removes noise, inverts data into density/susceptibility models, and correlates anomalies to known mineral systems. You receive quantified uncertainties so your exploration decisions are data-driven and risk-aware.
 by mediazard
Upload your geochemical datasets—including elemental concentrations, isotope ratios, trace element profiles, or alteration mineralogy—and receive instant ore-type classifications tied to known deposit models. You get detailed interpretations of geochemical signatures, assessment of metallogenic potential, and actionable insights for exploration and resource estimation.
by mediazard
This skill guides you through building pedagogically sound Teachable courses that maximize student engagement and revenue. You'll apply evidence-based learning principles to structure modules, sequence content for optimal retention, validate market fit, and implement conversion-optimized pricing and upsell strategies—all tailored to Teachable's platform capabilities.
by mediazard
This skill helps you design Moodle courses built on clear learning outcomes, aligned assessments, and detailed rubrics for grading. You'll create coherent course architectures where every activity, assignment, and evaluation criterion directly supports your students' learning goals—ensuring pedagogical soundness from design through implementation.
by mediazard
You systematically evaluate and rank exploration targets using structured geological assessment frameworks, risk matrices, and quantitative scoring methods. By analyzing geological indicators, economic factors, technical risks, and market conditions, you generate prioritized target rankings with transparent scoring rationale that help you allocate exploration budgets effectively and reduce uncertainty in investment decisions.
by mediazard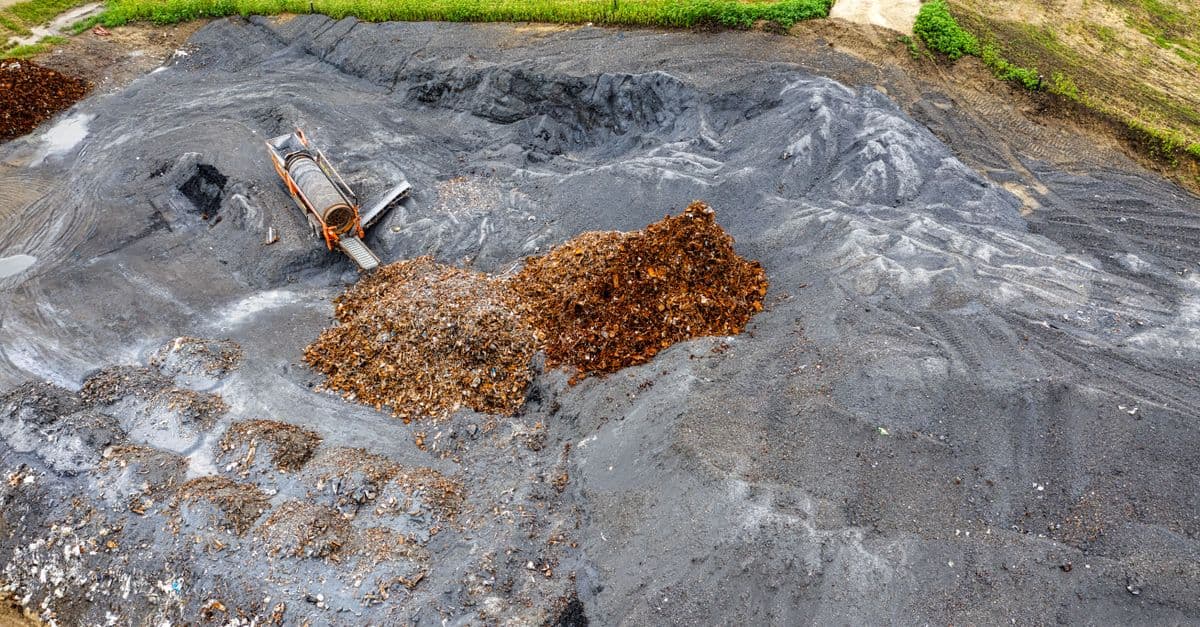
You interpret hydrogeological and chemical data to systematically characterize contamination sources, map exposure pathways, and evaluate migration risk. You synthesize site data into a defensible conceptual model, compare remedial technologies against regulatory requirements and cost-benefit criteria, and produce decision-support documentation for stakeholders. This accelerates compliance timelines and helps you select the most cost-effective remediation strategy for complex multi-contamination scenarios.
by mediazard
You can build, parameterize, and validate numerical groundwater flow models using structured workflows for data interpretation and calibration. The skill guides you through conceptual model development, parameter estimation, sensitivity analysis, and model documentation that meets professional standards for water resource engineering and hydrogeological consulting projects.
by mediazard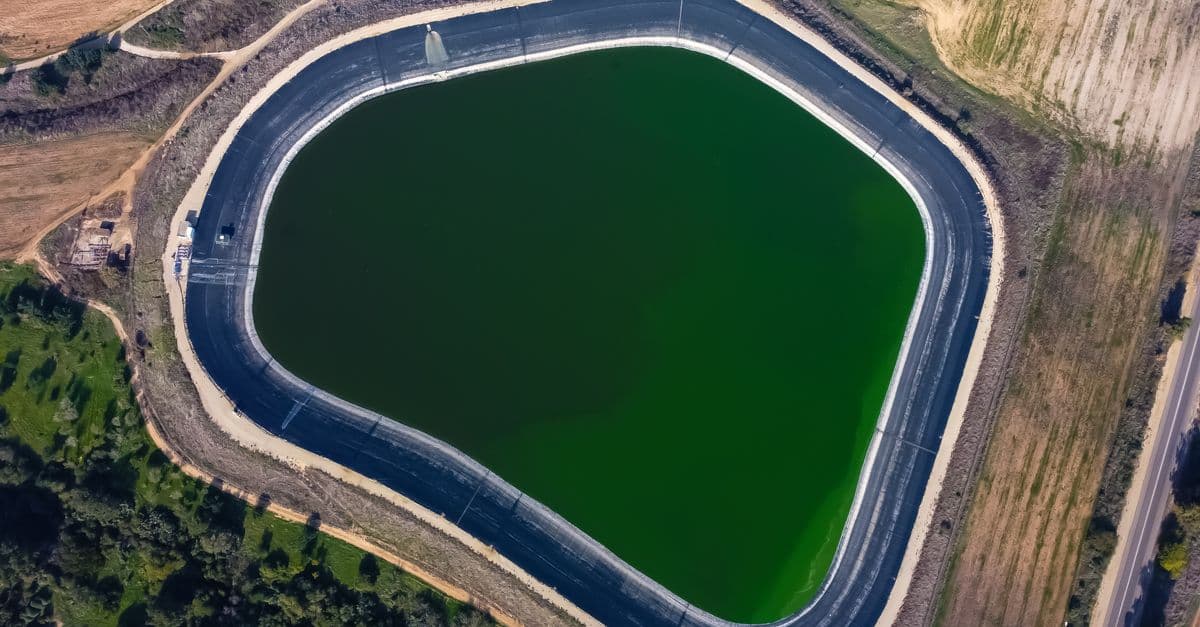
You can analyze site contamination data and model contaminant fate and transport to predict plume migration. You'll generate quantified risk assessments that demonstrate regulatory compliance, then design and cost-justify remediation strategies tailored to your site's hydrogeology and regulatory requirements.
by mediazard