

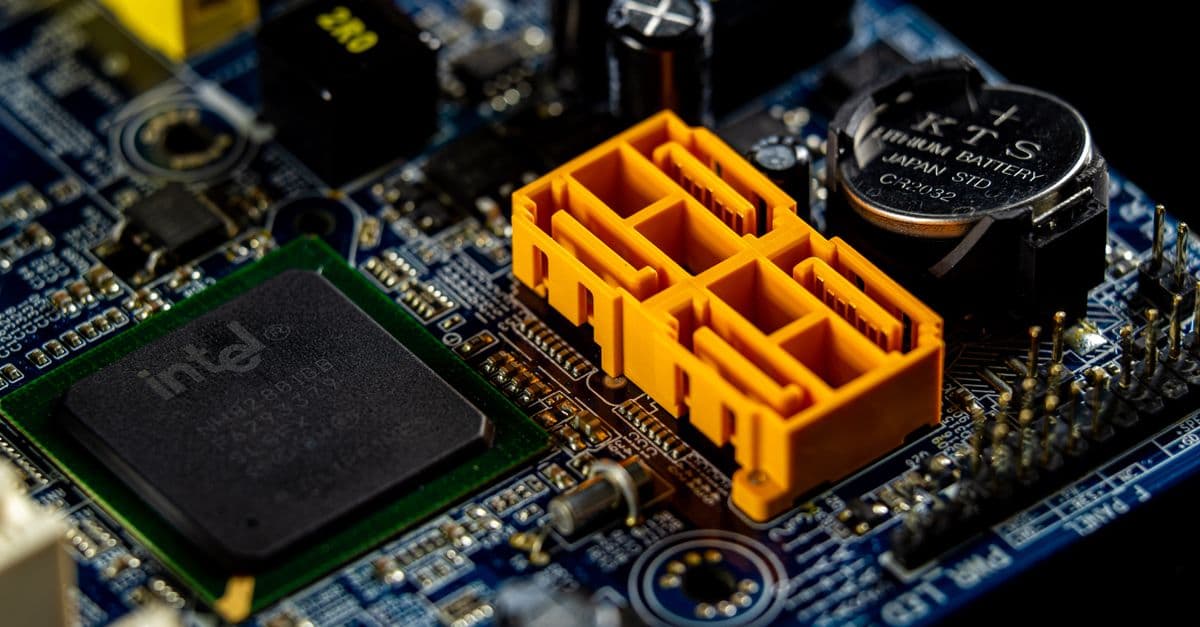
Embedded Firmware Debugger
Debug embedded firmware crashes in minutes with dump analysis

What You Can Do
You can analyze firmware crash dumps, register states, and memory layouts to identify root causes without manual hex digging. This skill reconstructs stack traces, detects memory corruption patterns, and flags real-time constraint violations. It supports ARM Cortex-M, RISC-V, and other architectures, helping you pinpoint elusive bugs in production scenarios or post-mortem investigations.
Features
Extract meaningful data from ELF binaries and core dumps with symbol resolution
Decode ARM/RISC-V registers and identify suspicious values and state anomalies
Map stack, heap, and data segments to detect corruption boundaries and overflow
Link addresses to function symbols and source code lines for fast navigation
Spot priority inversion, deadlocks, and scheduler constraint violations
Debug ARM Cortex-M, RISC-V, x86, and PowerPC firmware issues
Parse GDB output and breakpoint logs for correlating crashes with system state
Trace initialization sequences and memory remapping issues
Example Output
Example 1: Hard Fault Diagnosis
Input: ARM Cortex-M4 crash dump with registers r0-r15, PSR, CFSR, BFAR
Output:
- Root Cause: Stack overflow in ISR context
- Evidence: PSR.SPSEL=1, stack pointer 0x20000100 collides with heap at 0x20000104
- Call Stack: HardFault_Handler ← SysTick_ISR ← malloc (recursive call)
- Recommendation: Increase stack size or refactor ISR to use static buffers
Example 2: Memory Corruption Detection
Input: Heap corruption at 0x20002000, adjacent block overwritten
Output:
- Corruption Pattern: Size marker overwritten with 0xDEADBEEF
- Suspect Allocation: malloc at main.c:142 allocated 64 bytes, wrote 128
- Root Cause: strcpy without bounds checking in parse_config()
- Fix: Replace with strncpy and verify bounds at compile-time
What's Included
- SKILL.md: Embedded firmware debugging workflows and decision trees
- Crash Dump Analysis Checklist: Step-by-step guide for interpreting register states and stack traces
- Register Reference: ARM Cortex-M and RISC-V register field meanings and exception codes
- Memory Corruption Template: Heap/stack overflow detection and boundary analysis
- GDB Command Cheat Sheet: Extract memory, dump registers, set breakpoints, automate inspection
- Post-Mortem Workflow: Analyze production crashes without live device access
Who It's For
- Embedded Systems Engineers — Debug firmware in microcontrollers and SoCs
- Firmware Developers — Diagnose RTOS and bootloader issues
- Device Driver Engineers — Analyze kernel crashes and memory violations
- IoT/Edge Developers — Troubleshoot production deployments remotely
- Hardware Validation Engineers — Correlate crashes with hardware state transitions
Best For
- Production Crash Analysis — Diagnose crashes without live device access
- Memory Corruption — Detect heap overflow, stack corruption, and use-after-free bugs
- Real-Time Issues — Identify priority inversion, missed deadlines, and scheduler violations
- Bootloader Debugging — Trace initialization sequences and memory remapping problems
- RTOS Integration — Analyze task state, semaphore deadlocks, and context switch anomalies
You might also like

You can systematically diagnose database performance bottlenecks by sharing your schema, slow query logs, and execution plans with Claude. It identifies root causes—missing indexes, inefficient joins, lock contention—and provides prioritized recommendations with ready-to-implement SQL. Skip the manual log analysis and get tuning strategies tailored to your workload.

Use Claude to systematically analyze your database queries, execution plans, and schema to identify performance bottlenecks. The skill generates actionable optimization recommendations with SQL rewrites, index strategies, and configuration tuning. You'll receive detailed before-and-after performance analysis to validate improvements and prioritize work by impact.
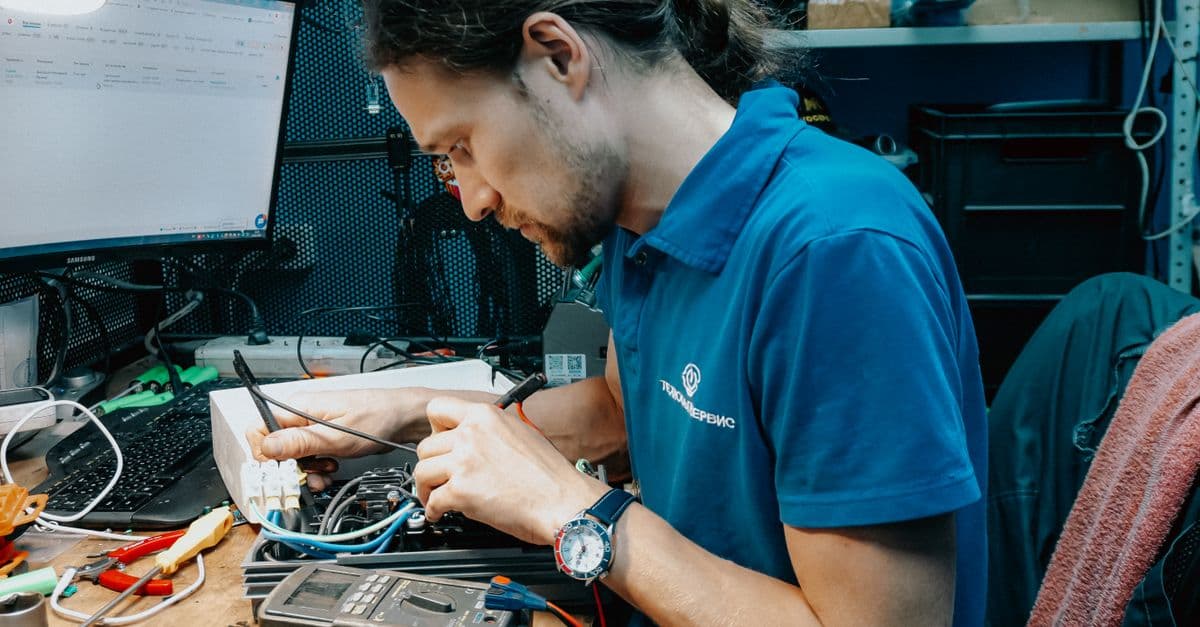
Rapidly analyze firmware logs and diagnose hardware issues that cause device failures, connectivity problems, and performance degradation. You'll identify root causes from stack traces, crash dumps, and sensor data, then generate specific optimization recommendations. This skill transforms raw device logs into actionable debugging plans that reduce time-to-resolution from hours to minutes.

You'll develop systematic approaches to injectable formulation design, from API selection through sterilization strategy. Claude helps you troubleshoot failed batches by analyzing root causes, recommends regulatory pathways (505(b)(2), ANDA, NDA), and provides science-backed solutions for stability, compatibility, and manufacturability challenges.

You'll design and implement mobile features with architectural rigor, cross-platform considerations, and edge-case handling built-in. This skill generates complete system designs, platform-specific implementation strategies, performance optimization approaches, and testing frameworks. The output is production-ready guidance spanning iOS and Android with security, offline resilience, and deployment strategies included.

Claude analyzes your code diffs and generates standardized commit messages that follow the Conventional Commits specification. The skill automatically determines the correct commit type, scope, and description based on the changes you've made, ensuring your messages are parseable by automation tools while remaining human-readable for code reviewers.

You can transform raw text into structured, labeled datasets for machine learning, analysis, and research. This skill performs named entity recognition, sentiment classification, part-of-speech tagging, and dependency parsing—generating consistent, validated annotations at scale. Use it to prepare corpora, extract entities, classify documents, or perform linguistic analysis without manual annotation.
You can architect multi-node ROS control systems from scratch, including node design patterns, communication flows, and real-time constraints. You'll debug complex node interactions using publisher/subscriber analysis, service call tracing, and action server diagnostics. You can optimize motion controllers through PID tuning, trajectory planning validation, and performance profiling to achieve precise, responsive robotic behavior.