

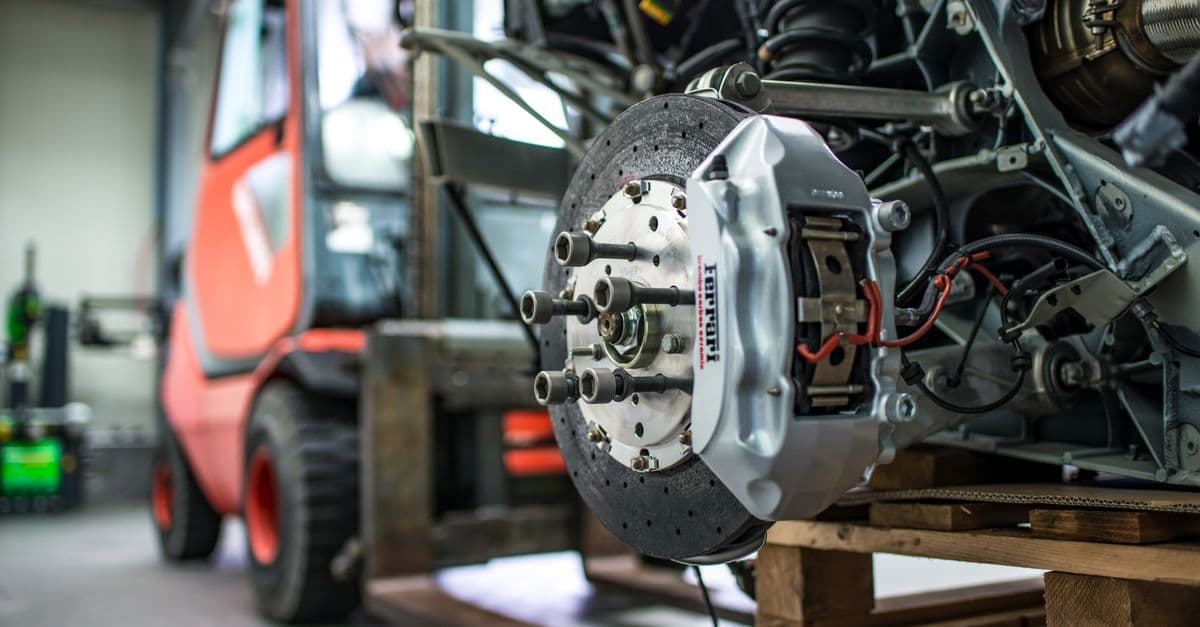
Suspension Dynamics Analysis Assistant
Analyze suspension kinematics and dynamics to optimize handling and ride comfort

What You Can Do
You can extract and validate suspension geometry parameters from vehicle designs, map compliance characteristics across load ranges, predict handling responses to suspension changes, and identify root causes of ride, handling, or durability issues. Claude helps you interpret multi-dimensional test data, analyze force paths under specific drive conditions, and generate actionable design recommendations backed by engineering principles.
Features
Extract camber, caster, toe, roll center, and instant center parameters to understand suspension behavior across travel range
Characterize bushing rates, mounting point deflection, and load-deflection curves to predict NVH and handling sensitivity
Model understeer/oversteer bias, roll stiffness distribution, and transient response to suspension geometry or stiffness changes
Predict component stresses and force flows under cornering, braking, acceleration, and bump inputs
Analyze slalom, lane change, skidpad, and compliance test results to validate suspension performance against targets
Evaluate MacPherson, double-wishbone, multi-link, and independent suspension designs for specific vehicle segments
Diagnose unexpected handling behavior, NVH issues, or durability concerns by tracing symptoms to suspension parameters
Prepare technical reports and cross-functional summaries of suspension changes and performance impacts
Example Output
Example 1: Camber Loss Analysis Input: Front camber angle vs. suspension travel data and handling feedback from test driver. Output: Quantified camber loss rate (°/mm), impact on lateral load transfer (0.3° loss = 2% roll stiffness reduction), and recommendation to adjust upper control arm geometry by 15 mm to reduce compliance sensitivity.
Example 2: Understeer Diagnosis Input: Skidpad test results showing 1.2g lateral acceleration at understeer threshold with stock suspension. Output: Root cause identified as insufficient front roll stiffness (front:rear ratio 1.1:1 vs. target 1.3:1). Recommendation: increase front spring rate 8% or reduce rear bar stiffness 6% to achieve balanced handling.
Example 3: Compliance Mapping Report Input: Bushing test data showing nonlinear load-deflection curves across temperature and load conditions. Output: Compliance matrix showing lateral stiffness (450 N/mm at 25°C, 380 N/mm at 60°C), longitudinal stiffness (620 N/mm), and mounting point deflection under 1g cornering load (±2.1 mm). Identifies resonance risk at 8.3 Hz if damping insufficient.
What's Included
- SKILL.md instruction file: Complete suspension analysis framework with geometry, compliance, and dynamics workflows
- Kinematics Analysis Template: Structured worksheet for extracting and validating suspension geometry (camber, caster, toe, roll center, scrub radius)
- Compliance Mapping Checklist: Step-by-step guide to characterize bushing stiffness, mounting point deflection, and load-deflection curves
- Test Data Interpretation Framework: Methodology for analyzing slalom, lane change, skidpad, and compliance test results
- Handling Prediction Worksheet: Structured approach to predict understeer/oversteer bias and transient response to suspension changes
Who It's For
- Suspension engineers — Analyzing kinematics, optimizing geometry, and troubleshooting handling or durability issues
- Vehicle dynamics engineers — Predicting handling behavior, load paths, and compliance sensitivity across drive conditions
- NVH engineers — Diagnosing suspension-related vibration and noise through compliance analysis and resonance mapping
- Test engineers — Interpreting vehicle dynamics test data (slalom, lane change, skidpad) and correlating results to suspension design
- Design engineers — Evaluating suspension architectures and generating technical documentation for cross-functional teams
Best For
- Diagnosing understeer/oversteer bias and handling imbalances
- Evaluating the impact of suspension geometry changes on ride and handling
- Analyzing compliance characteristics and predicting NVH sensitivity
- Predicting load paths and component stresses under cornering and braking
- Comparing suspension architectures (MacPherson vs. double-wishbone vs. multi-link) for specific vehicle segments
- Troubleshooting ride comfort or durability issues traced to suspension compliance or resonance
You might also like

You can validate AUTOSAR software architectures across multiple compliance dimensions—layer separation, component interfaces, port definitions, service interfaces, and communication semantics. The skill identifies structural violations, missing documentation artifacts, and compliance gaps early in the design phase, helping you catch issues before formal gates and functional safety audits. It generates architecture compliance reports and documentation needed for ISO 26262 functional safety reviews.
You can submit proposed sensor fusion system architectures for structured validation that catches timing violations, coordinate frame mismatches, and redundancy gaps early in the design phase. Claude analyzes sensor interaction patterns, identifies data consistency requirements across cameras, LiDAR, radar, and inertial sensors, then generates detailed test matrices covering multi-sensor fallback modes and operational design domain constraints—accelerating pre-development reviews where architectural fixes are most cost-effective.

You can design complete AUTOSAR 4.x system architectures by automating component allocation across abstraction layers, modeling port interactions and service interfaces, and validating compliance with AUTOSAR standards. Claude helps you create standardized architecture documentation, detect circular dependencies and interface mismatches, and generate port interaction matrices—accelerating ECU architecture development while ensuring standards adherence.

You can analyze FEA thermal simulation data to identify motor hotspots, calculate heat generation from motor losses across operating points, evaluate competing cooling solutions quantitatively, and troubleshoot excessive temperature rise during dyno testing. The skill helps you validate thermal management design margins, assess motor lifetime degradation risk, and optimize cooling loop efficiency—enabling data-driven thermal design decisions before building prototypes.
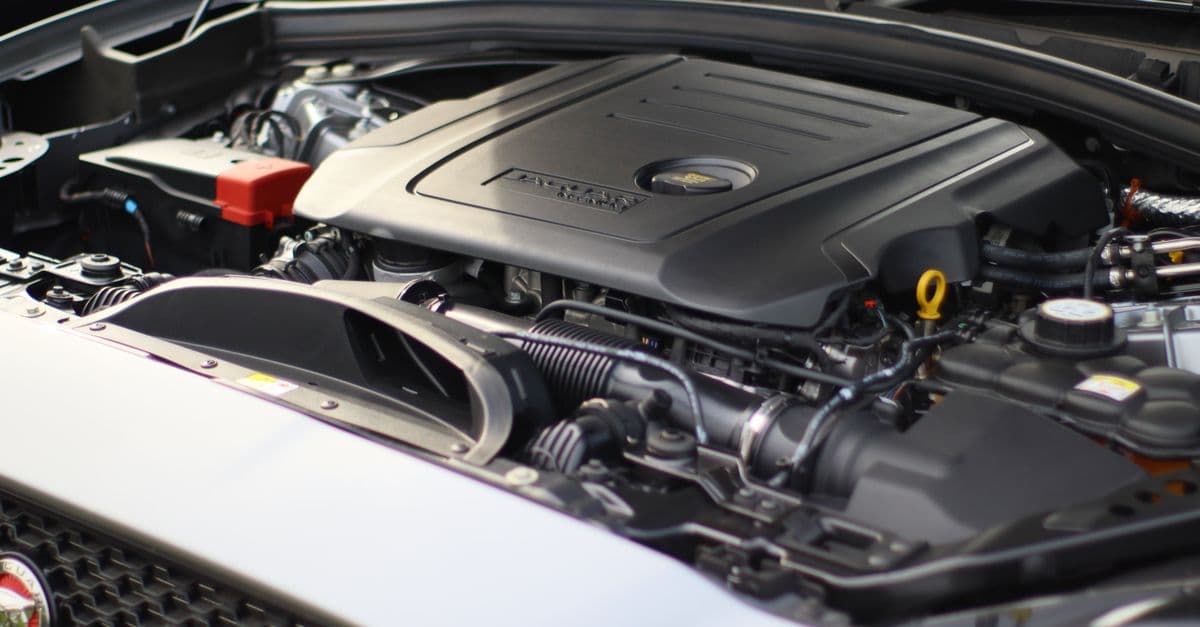
You can analyze embedded diagnostic code across five critical domains: CAN message parsing and protocol compliance, Diagnostic Trouble Code (DTC) generation logic, diagnostic state machine transitions, sensor fault detection thresholds, and diagnostic data link command handlers (UDS/KWP). The skill identifies logic errors, false-positive configurations, state transition gaps, and compliance deviations that would otherwise only surface during expensive dyno or road testing.
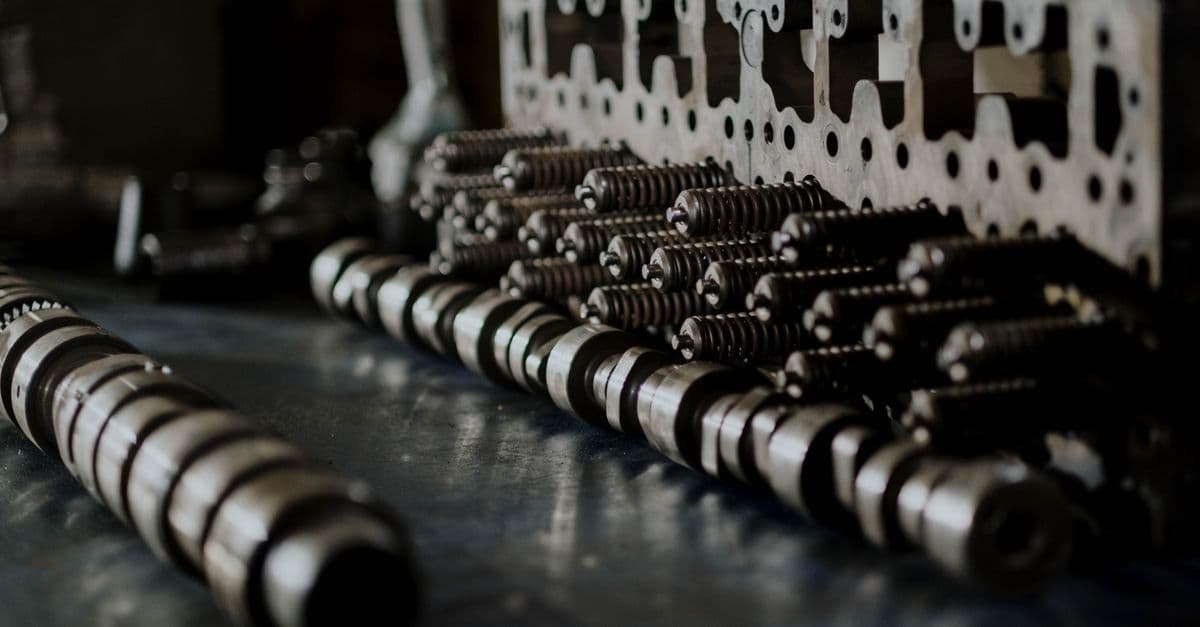
You can efficiently diagnose complex NVH concerns by working through a structured framework that correlates customer symptoms with potential powertrain failures. This skill helps you narrow diagnostic possibilities, recommend targeted testing sequences, distinguish between component failures and tuning issues, and substantiate warranty claims with technical evidence.

You can evaluate simulation scenarios against functional safety and SOTIF requirements, identify untested edge cases and high-risk operational design domains, map failure modes to root causes, and generate traceability matrices linking requirements to validation results. This skill transforms raw simulation data into defensible technical documentation that demonstrates test completeness and readiness for real-world deployment.
You can analyze multi-dimensional steering system performance including torque characteristics, self-alignment torque, steering angle feedback, road feel transmission, and torque vectoring effects. Extract actionable insights from simulation and test data to identify root causes of steering feel issues, then develop tuning recommendations for steering gear ratios, EPS algorithms, suspension geometry effects, and torque vectoring control strategies.