

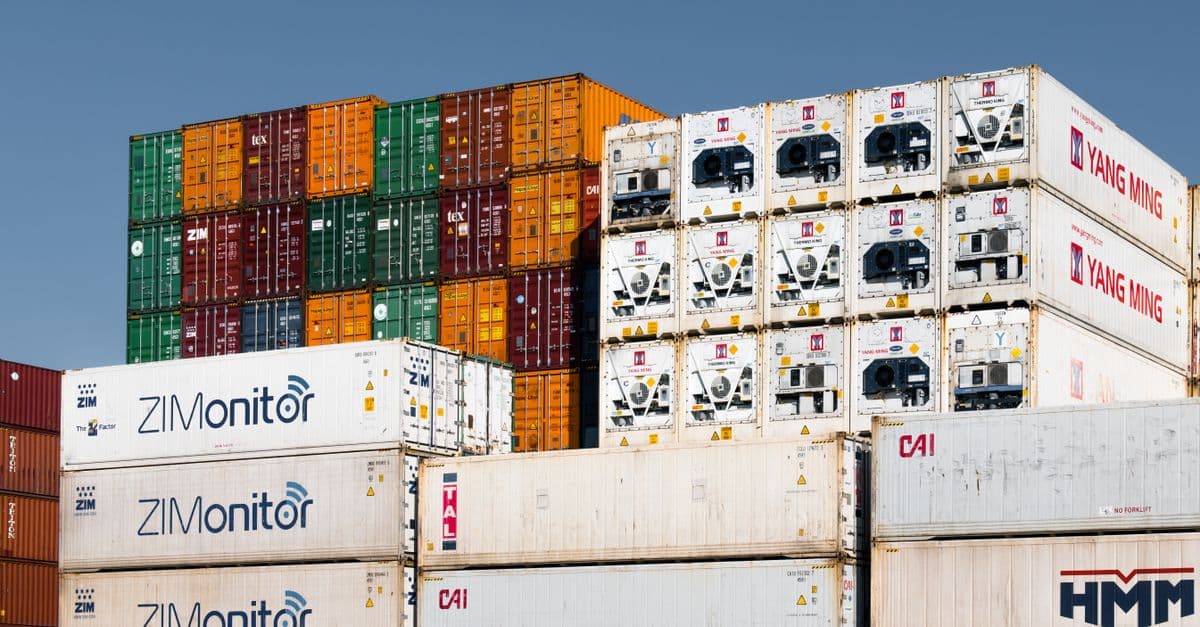
Intermodal Rate Optimization & Routing
Optimize intermodal freight routing and rate negotiations with multi-modal analysis

What You Can Do
You analyze complex freight scenarios combining truck, rail, ocean, and air modes to identify the lowest-cost routing options and equipment configurations. The skill structures rate negotiations by comparing carrier quotes, benchmarking costs against industry standards, and highlighting cost-reduction opportunities across equipment types and transport combinations.
Features
Evaluate cost tradeoffs across truck, rail, ocean, and air combinations to find the optimal routing for your shipment profile and timeline constraints
Compare carrier quotes against historical rates and industry benchmarks to identify overpriced proposals and negotiate stronger terms
Calculate utilization rates, deadhead costs, and equipment positioning to maximize trailer and container efficiency across routes
Build data-backed negotiation frameworks showing carrier margin expectations, competitive alternatives, and cost reduction levers for each shipment type
Identify savings through mode switching, equipment consolidation, volume commitments, or timing adjustments without sacrificing service levels
Link rate quotes to historical carrier performance metrics like on-time delivery, damage rates, and compliance scores to evaluate true cost of service
Model cost impacts of volume changes, seasonal peaks, equipment constraints, or service level shifts to support strategic planning
Example Output
Example 1: Route Optimization
Shipment: 40,000 lbs, Los Angeles to Memphis, 5-day window
- Route A (Truck-only): $3,200 | 3 days | Direct
- Route B (Truck-Rail-Truck): $2,100 | 4.5 days | 34% savings, 1 mode transfer
- Route C (Ocean-Rail-Truck): $1,650 | 5 days | 48% savings, origin on coast
Recommendation: Route B offers best balance of cost and transit time for typical Memphis freight.
Example 2: Negotiation Framework
Carrier ABC Quote: $2,800 for weekly lane Los Angeles-Dallas
- Market rate (3-carrier average): $2,400
- Your volume commitment: 10 shipments/week = 52,000 lbs annually
- Negotiation leverage: "Competitive quote at $2,400. Offer volume commitment for $2,150 + fuel escalator"
- Potential savings: $650/week = $33,800 annually
Example 3: Equipment Efficiency
Current fleet: 40 53-ft containers, 65% utilization on rail
- Estimated deadhead miles: 8,760 monthly (unloaded returns)
- Equipment cost per shipment: $180
- Improvement: Add drop-deck equipment for heavy commodities, increase utilization to 78%
- New cost per shipment: $148
- Annual savings: $15,360 per 100-shipment volume
What's Included
- Rate negotiation playbook: Templates for structuring negotiations with carriers including benchmark data, volume commitment strategies, and margin analysis frameworks
- Multi-modal routing optimizer: Framework for evaluating cost, transit time, and service tradeoffs across truck, rail, ocean, and air combinations for any origin-destination pair
- Equipment compatibility matrix: Reference guide mapping commodity types, weight, dimensions, and hazmat classifications to compatible equipment options and mode constraints
- Cost reduction opportunity scanner: Analysis templates for identifying savings through consolidation, timing changes, equipment swaps, or carrier diversification
- Carrier performance scorecard: Framework for correlating quoted rates with on-time delivery performance, damage rates, and compliance metrics to evaluate true cost of service
Who It's For
- Freight brokers managing shipper accounts and carrier negotiations
- Logistics managers optimizing transportation spend and route networks
- Procurement specialists negotiating transportation contracts and carrier agreements
- Supply chain planners evaluating multi-modal options for complex shipments
- Intermodal coordinators managing equipment positioning and rail/ocean handoffs
Best For
- Analyzing 2-4 leg shipments combining truck, rail, ocean, or air segments
- Preparing data-backed carrier rate negotiations and contract renewals
- Identifying cost reduction opportunities across your transportation network
- Evaluating tradeoffs between service levels, transit times, and freight costs
- Planning equipment utilization and managing deadhead positioning costs
You might also like

Rapidly verify shipments, parties, and destinations against multiple global sanctions lists including OFAC SDN, EU consolidated list, and UN designations. Generate compliance decisions with complete audit trails, risk assessments, and regulatory documentation that satisfies internal review and external audits without manual spreadsheet work.

Analyze inbound shipping documentation to verify receipt accuracy against purchase orders, bills of lading, and carrier documentation. Identify and categorize discrepancies like missing items, quantity variances, and damage claims. Generate exception reports and provide resolution guidance to streamline your receiving operations.

This skill helps you navigate Foreign Trade Zone regulations by automating compliance audits, generating required documentation, and verifying import-export procedures. You'll receive detailed compliance checklists, tariff classification guidance, and ready-to-use documentation templates that meet CBP requirements, reducing errors and audit risk.

Transform your carrier relationships with structured performance analysis and strategic negotiations. You'll evaluate carrier metrics across cost, service quality, and reliability to build scorecards that drive informed decisions on contract renewals, price optimization, and expansion opportunities. This skill prepares rate negotiation strategies, identifies dispute root causes, and recommends retention or exit decisions backed by quantitative data.

Transform unstructured diary entries into coded themes, behavioral patterns, and evidence-based design recommendations. You can process 10+ participant diaries at scale while maintaining contextual richness, identify recurring behaviors across cohorts rather than isolated incidents, and surface emotional and situational triggers that inform product direction. This approach bridges the gap between raw qualitative data and actionable design strategy.

This skill transforms raw carrier data into actionable intelligence for your supply chain. You provide metrics like delivery times, costs, service levels, and volume data, and the skill delivers comprehensive performance analysis, cost-benefit comparisons, and strategic optimization recommendations. Use it to identify underperforming carriers, negotiate better contracts, and restructure your logistics network for maximum efficiency.

This skill helps you navigate complex Free Trade Zone regulations and tariff rules with confidence. You can verify product classifications, calculate accurate duties and landed costs, assess regulatory compliance, and prepare audit-ready documentation. Get instant guidance on trade agreements, import/export scenarios, and compliance risks without manual research.

Upload multiple partial LTL shipments and receive data-driven consolidation recommendations with precise margin calculations. This skill analyzes your shipment characteristics against current market rates to identify cost-saving opportunities and prioritizes consolidation scenarios by profitability impact. Get actionable rate recommendations that balance cost reduction with service commitments.