

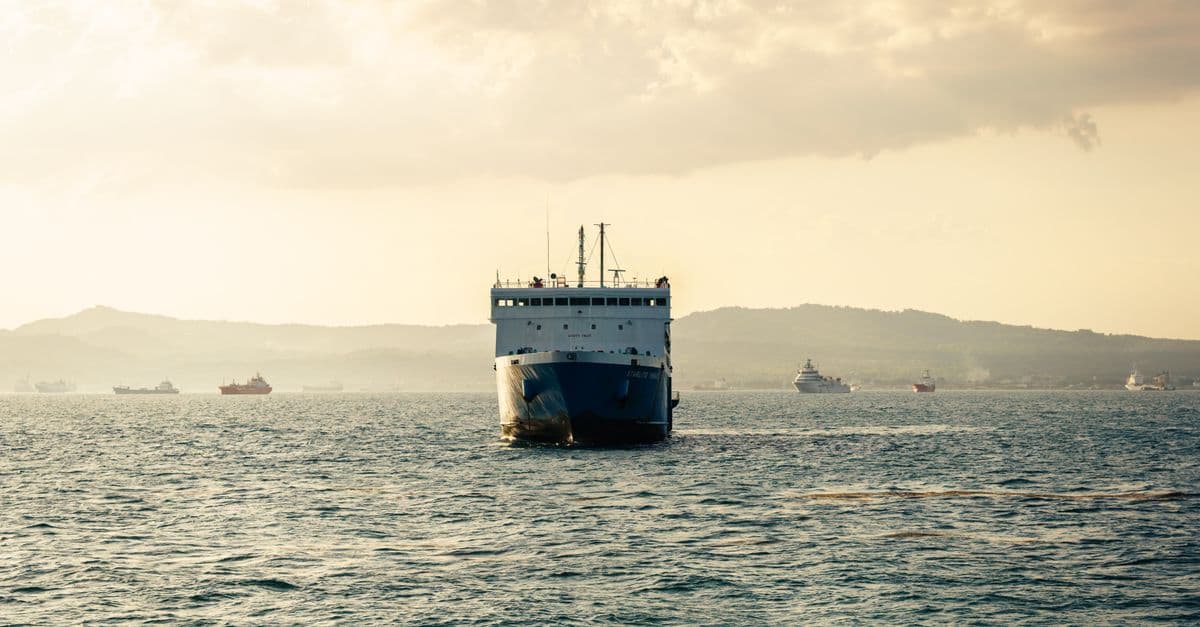
Tramp Voyage Economics & Route Optimizer
Optimize tramp voyage routes and profitability with AI-powered economics modeling
What You Can Do
You can analyze the complete financial picture of any tramp shipping voyage, from fuel consumption and port costs to crew expenses and regulatory compliance. Claude models different routing scenarios, cargo combinations, and market conditions to identify the most profitable voyage options. Whether you're evaluating a specific rate proposal or testing multiple what-if scenarios for fleet deployment, you get detailed cost breakdowns, margin analysis, and actionable recommendations.
Features
Automatically calculates all voyage costs including fuel consumption, port charges, canal fees, crew expenses, insurance, and maintenance allocations to generate accurate profitability metrics.
Tests alternative routing options based on distance, weather patterns, fuel efficiency, and port costs to identify the route that maximizes voyage profit margin.
Compare multiple voyage scenarios simultaneously—different routes, cargo mixes, bunker purchase timing, or charter rates—to stress-test profitability assumptions.
Incorporates current freight rates, bunker prices, and port tariffs into calculations so your analysis reflects real market conditions and spot opportunities.
Calculates minimum viable freight rates, utilization levels, and cargo volumes needed to break even on any proposed voyage or contract.
Recommends vessel assignments and deployment strategies based on cargo characteristics, vessel performance profiles, and market demand across trade lanes.
Monitors fuel specifications, emissions regulations, ballast water compliance, and insurance requirements to ensure all voyages meet mandatory standards.
Exports structured summaries, spreadsheets, and board-level presentations ready to share with operators, commercial teams, and management.
Example Output
Example 1: Voyage Profitability Assessment
Input: Singapore → Rotterdam on a 25,000 dwt bulk carrier
Output:
Route: Singapore–Suez–Rotterdam (12,850 nm)
Fuel consumption: 245 tons IFO 380
Voyage cost: $487,300
Freight revenue: $625,000
Net voyage profit: $137,700
Profit margin: 22%
Break-even rate: $19.50/ton
Example 2: Route Optimization Comparison
| Route | Distance | Fuel Cost | Port Cost | Total Cost | Margin |
|---|---|---|---|---|---|
| Suez | 12,850 nm | $142,500 | $28,700 | $487,300 | 22% |
| Cape | 16,200 nm | $227,500 | $24,000 | $572,300 | 8% |
| Recommendation: Suez route unless closure occurs |
Example 3: Scenario Bidding Analysis
45,000 bbl crude tanker fixture:
- Conservative bid ($2.50/bbl): $28,500 profit
- Market rate ($3.10/bbl): $93,600 profit ← Recommended
- Optimistic bid ($3.75/bbl): $158,700 profit (only if market favorable)
What's Included
- Voyage Profitability Calculator: Step-by-step template covering all standard voyage expenses and revenue categories.
- Route Optimization Workflow: Structured decision process for evaluating distance, fuel efficiency, port selection, and regulatory routing.
- Scenario Comparison Framework: Side-by-side comparison templates for testing multiple routes, cargo mixes, and market conditions.
- Market Data Integration Guide: Instructions for feeding real freight rates, bunker costs, and port tariffs into your analysis.
- Compliance Checklist: Regulatory tracking for bunker fuel specs, emissions limits, ballast water treatment, and insurance requirements.
- Executive Report Templates: Ready-to-use formats for voyage summaries, board presentations, and stakeholder communication.
Who It's For
- Tramp Ship Operators
- Commercial Managers & Voyage Planners
- Freight Forwarders & Logistics Coordinators
- Shipping Brokers & Traders
- Chartering Teams & Asset Managers
Best For
- Pre-voyage profitability assessments
- Route selection and optimization
- Scenario planning and what-if analysis
- Rate negotiation support and justification
- Fleet deployment and utilization decisions
You might also like
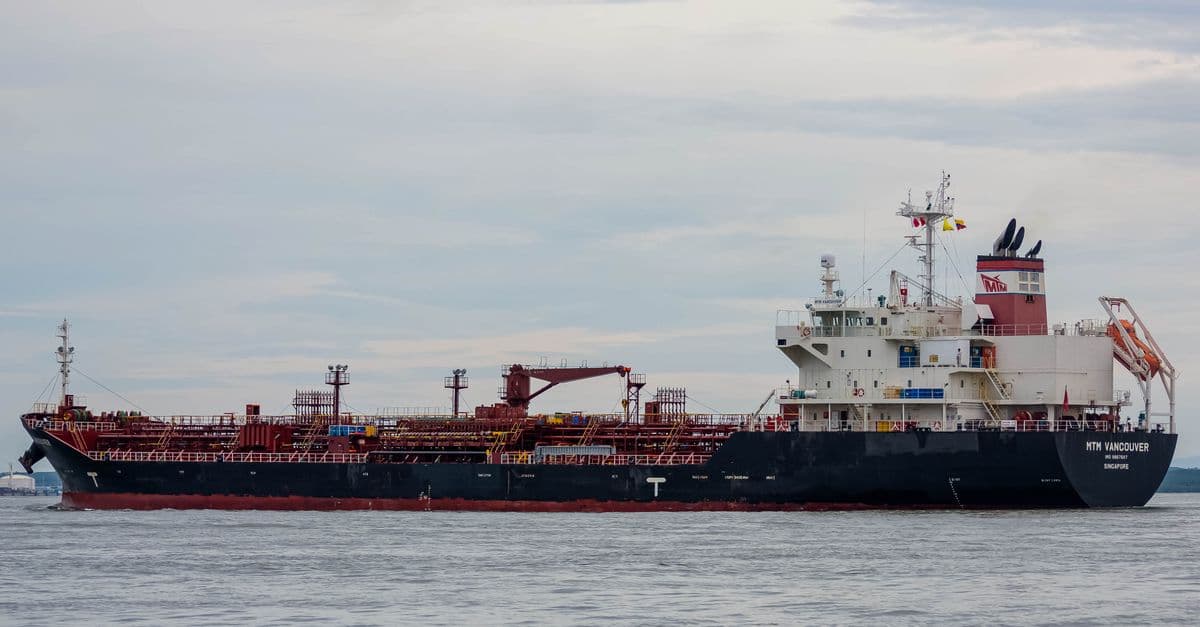
You get a structured framework for evaluating voyage economics comprehensively—from fuel costs and port expenses to market rates and TCE (Time Charter Equivalent) calculations. The skill automates breakeven analysis, route comparison, and acceptance/rejection criteria so you can make data-driven decisions on which voyages to commit to. It also flags risk factors and highlights optimization opportunities across route segments.
 by leoyeai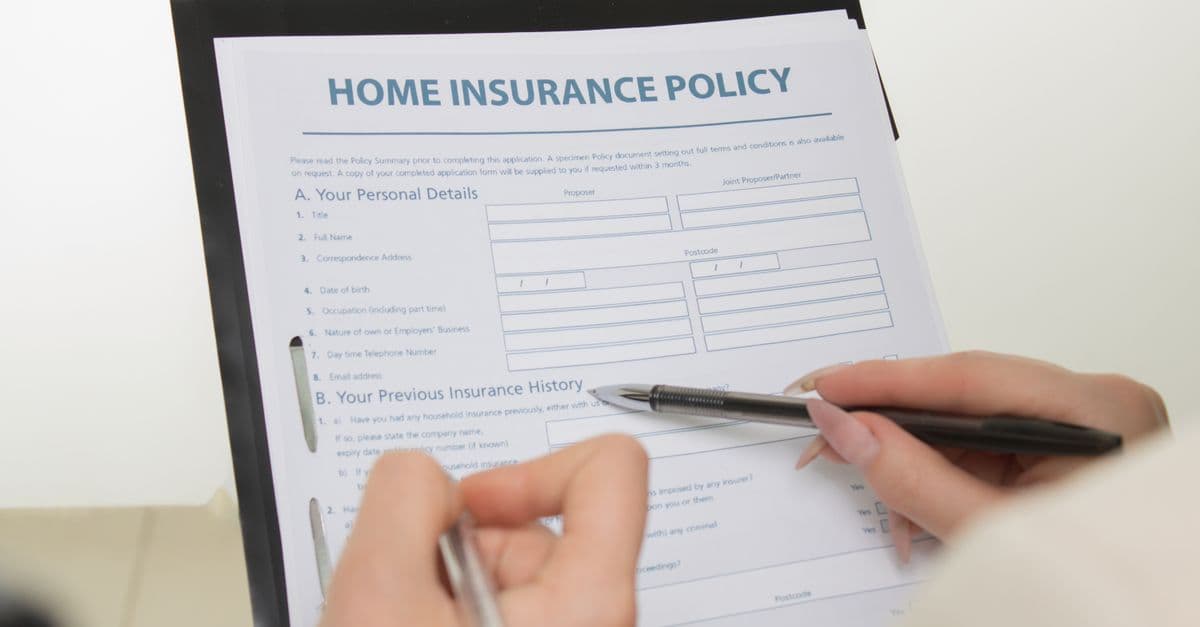
Generate comprehensive hull insurance underwriting summaries by analyzing vessel specifications, loss history, and operational factors. This skill evaluates marine risk profiles, identifies underwriting concerns, and produces professional summary documents for insurers and brokers. Streamline your underwriting workflow by automating risk assessment and documentation for maritime hull policies.
by leoyeai
Rapidly evaluate the impact of port closures, labor actions, weather delays, and equipment failures on your liner schedule. You receive data-driven rerouting recommendations that balance fuel costs, transit time, and customer commitments—plus ready-to-send communication templates to keep stakeholders informed and preserve margins.
by leoyeai
This skill helps you systematically analyze air freight rates, identify negotiation leverage points, and uncover cost-saving opportunities across your carrier network. You provide rate quotes, historical data, or carrier catalogs, and Claude returns detailed cost comparisons, margin analysis, and targeted negotiation strategies to improve your bottom line. You'll discover competitive benchmarks, volume discount opportunities, and contract optimization recommendations specific to your shipping profile.
by leoyeai
You get instant dangerous goods classification with UN numbers, regulatory compliance requirements, and shipping documentation. This skill analyzes material properties, determines hazard classes, recommends appropriate packaging, and generates compliance checklists for IATA, IMDG, DOT, and ADR standards. You receive actionable guidance for safe transport, proper labeling, and regulatory adherence across all shipping modes.
by leoyeai
You can generate comprehensive cargo operation plans for tanker vessels that identify all hazards, create detailed crew procedures, and assess operational risks. This skill analyzes vessel specifications, cargo characteristics, and port conditions to produce actionable safety plans. You get ready-to-use checklists, risk matrices, and crew briefing documents that meet maritime safety standards.
by leoyeai
Automatically audit your ocean freight documentation against maritime regulations, carrier requirements, and port regulations. This skill reviews bills of lading, packing lists, customs forms, and shipping instructions to identify compliance gaps, missing fields, and regulatory violations before they delay your shipment or trigger port holds.
by leoyeai
This skill analyzes your customer acquisition costs across all marketing channels, benchmarks performance against industry standards, and identifies high-ROI opportunities for budget reallocation. You receive detailed metrics on cost-per-acquisition, payback periods, and lifetime value ratios by channel, plus specific recommendations for where to increase or decrease spending to maximize overall profitability.
by leoyeai